Logo of a company with the name "Xsphere" in a modern design, featuring bold blue and green colors.
Wide aerial view of a wind farm at sunset with multiple turbines across a rugged landscape, including a turbine under construction with cranes and vehicles visible below.

Wind

Turbines on Track

Turbines on Track

Ditch manual site walks and fragmented spreadsheets. TaskMapper brings your entire jobsite into a single, GIS-powered digital twin, seamlessly syncing heavy crane movements, foundation pours, and blade lifts directly to your master schedule.

Ditch manual site walks and fragmented spreadsheets. TaskMapper brings your entire jobsite into a single, GIS-powered digital twin, seamlessly syncing heavy crane movements, foundation pours, and blade lifts directly to your master schedule.

Dashboard overlay on a solar farm showing portfolio metrics and a bar chart comparing planned vs actual project progress.

Trusted by Teams Building and Operating Wind at Scale

projects digitized

0+

countries in operations

0+

countries in operations

0+

ROI on large rollouts

0x

ROI on large rollouts

0x

of Turbine Installs

0s km

of Turbine Installs

0s km

One Platform for the Entire Wind Lifecycle

Map view showing highlighted areas with coordinates and options for distance measurement at the bottom.
A mobile screen displaying a bar graph with various colored bars and options for data visualization.
A colorful grid pattern with vertical lines in shades of purple, pink, and orange, accompanied by numerical values.

Your Wind data lives in spreadsheets, ERPs, and WhatsApp threads. These data silos prevent easy transfer of information between teams during Development, Construction and Handover to Operations.

SenseHawk brings it all into one map-based platform — connecting scattered teams, fragmented workflows, and lifecycle gaps into a single source of truth.

The Wind Value Chain

Empowering Every Role in the Wind Value Chain

From site suitability to repowering, we provide a unified geospatial system of record - connecting distributed teams and siloed data across your entire wind portfolio.

A man presents data on a screen to a group of colleagues in a modern office setting.

Owners & IPPs

Command your entire portfolio from one screen

Gain instant visibility on S-curves, critical activities, and milestones across your entire portfolio. Escape the trap of weekly PDF reports by relying on a live Digital Twin to monitor progress, benchmark contractors, and protect your ROI.

Track real-time overall progress and planned vs. actual trends.

Use the NaaviX AI Copilot to ask natural language questions like "What activities are delayed?".

Access predictive insights to identify schedule risks before they impact timelines.

Ensure complete auditability with time-stamped, geo-referenced records.

A person working at a desk, looking at a computer monitor displaying a spreadsheet or data table.

Planning

Align baseline schedules with field reality

Connect your high-level planning directly to execution by importing Primavera P6 or MS Project schedules into the platform. TaskMapper links your L5-level construction workflows to these schedules, providing a seamless bridge between planning and real-world execution.

Upload Primavera P6 or MS Project files (.mpp, .xer, .csv, .xlsx).

Link L5 activities to downstream construction workflows for seamless schedule integration.

Generate live S-curves and progress dashboards automatically linked to project schedules.

Enable proactive risk management with automated alerts for delay detection.

A worker in a hard hat operates a yellow drilling machine under a clear blue sky, near solar panels.

Project Management

Real-time visibility from first anchor bolt to final blade lift

Manage execution effectively by tracking actual versus planned productivity daily. TaskMapper connects drone data, field inspections, and turbine component logistics to the digital system model, allowing you to reduce rework and accelerate decision-making.

Track serialized turbine components (blades, nacelles, tower sections) from warehouse receipt to final lift

Monitor daily cut/fill analysis for roads and turbine pads and detect deviations using drone intelligence.

Equip field crews with an offline-capable mobile app for geo-tagged photo capture and digital forms.

Identify schedule risks and reallocate crews to high-delay zones dynamically.

A worker in a hard hat and reflective vest checks a smartphone and tablet near solar panels in a field.

Safety

Proactively manage safety and reduce worksite risks

Replace paper safety permits and JSAs with digitized, verifiable forms. Track near-misses and observations in real-time, enabling immediate mitigation. Integrate safety data with your digital project model to identify hazard hotspots and improve long-term training.

Digitize and manage permits-to-work, JSAs, and Toolbox Talks from the field.

Record near-misses and unsafe conditions with photos, geotags, and severity.

Link safety observations to the 3D asset model for spatial hazard visualization.

Analyze site-wide safety trends to deploy targeted training and resources.

Ensure real-time safety compliance and reporting across multiple project teams.

A worker in a hard hat and bright jacket inspects electrical equipment in a solar panel installation.

Commissioning

Commissioning & Close Out

Ensure your constructed plant meets design and safety requirements before transitioning to operations. Accelerate commercial operation dates (COD) by compiling an audit-ready "Digital Twin" handover package containing all verified asset health data.

Automate pre-commissioning checklists for safety, electrical energization, and system readiness.

Digitize punch lists to geotag defects, assign tasks, and track closure.

Perform and record gearbox endoscope inspections, analyze generator performance data, and conduct drone scans, storing results against specific components.

Deliver complete as-built documentation, manuals, and warranties directly linked to equipment.

A technician in an orange uniform and helmet checks solar panels under a blue sky with clouds.

Asset Management & O&M

Shift from reactive to predictive maintenance

Maximize turbine availability and minimize downtime by integrating real-time operational data with inspection and sensor results. TaskMapper's AI-driven analytics classify component stress, detect potential faults, and estimate lifetime consumption, ensuring your team proactively fixes what matters most.

Apply AI-driven analysis to drone imagery to identify damage on blades, nacelles, and other highly stressed components.

Digitize punch lists to geotag defects (like blade damage or nacelle leaks), assign tasks, and track closure.

Capture vibration signatures, oil analysis results, and detailed blade inspection data, storing results against specific turbine components.

Streamline regulatory compliance with historical, component-level logs of all structural scans, oil analyses, and field repairs.

GIS Visibility

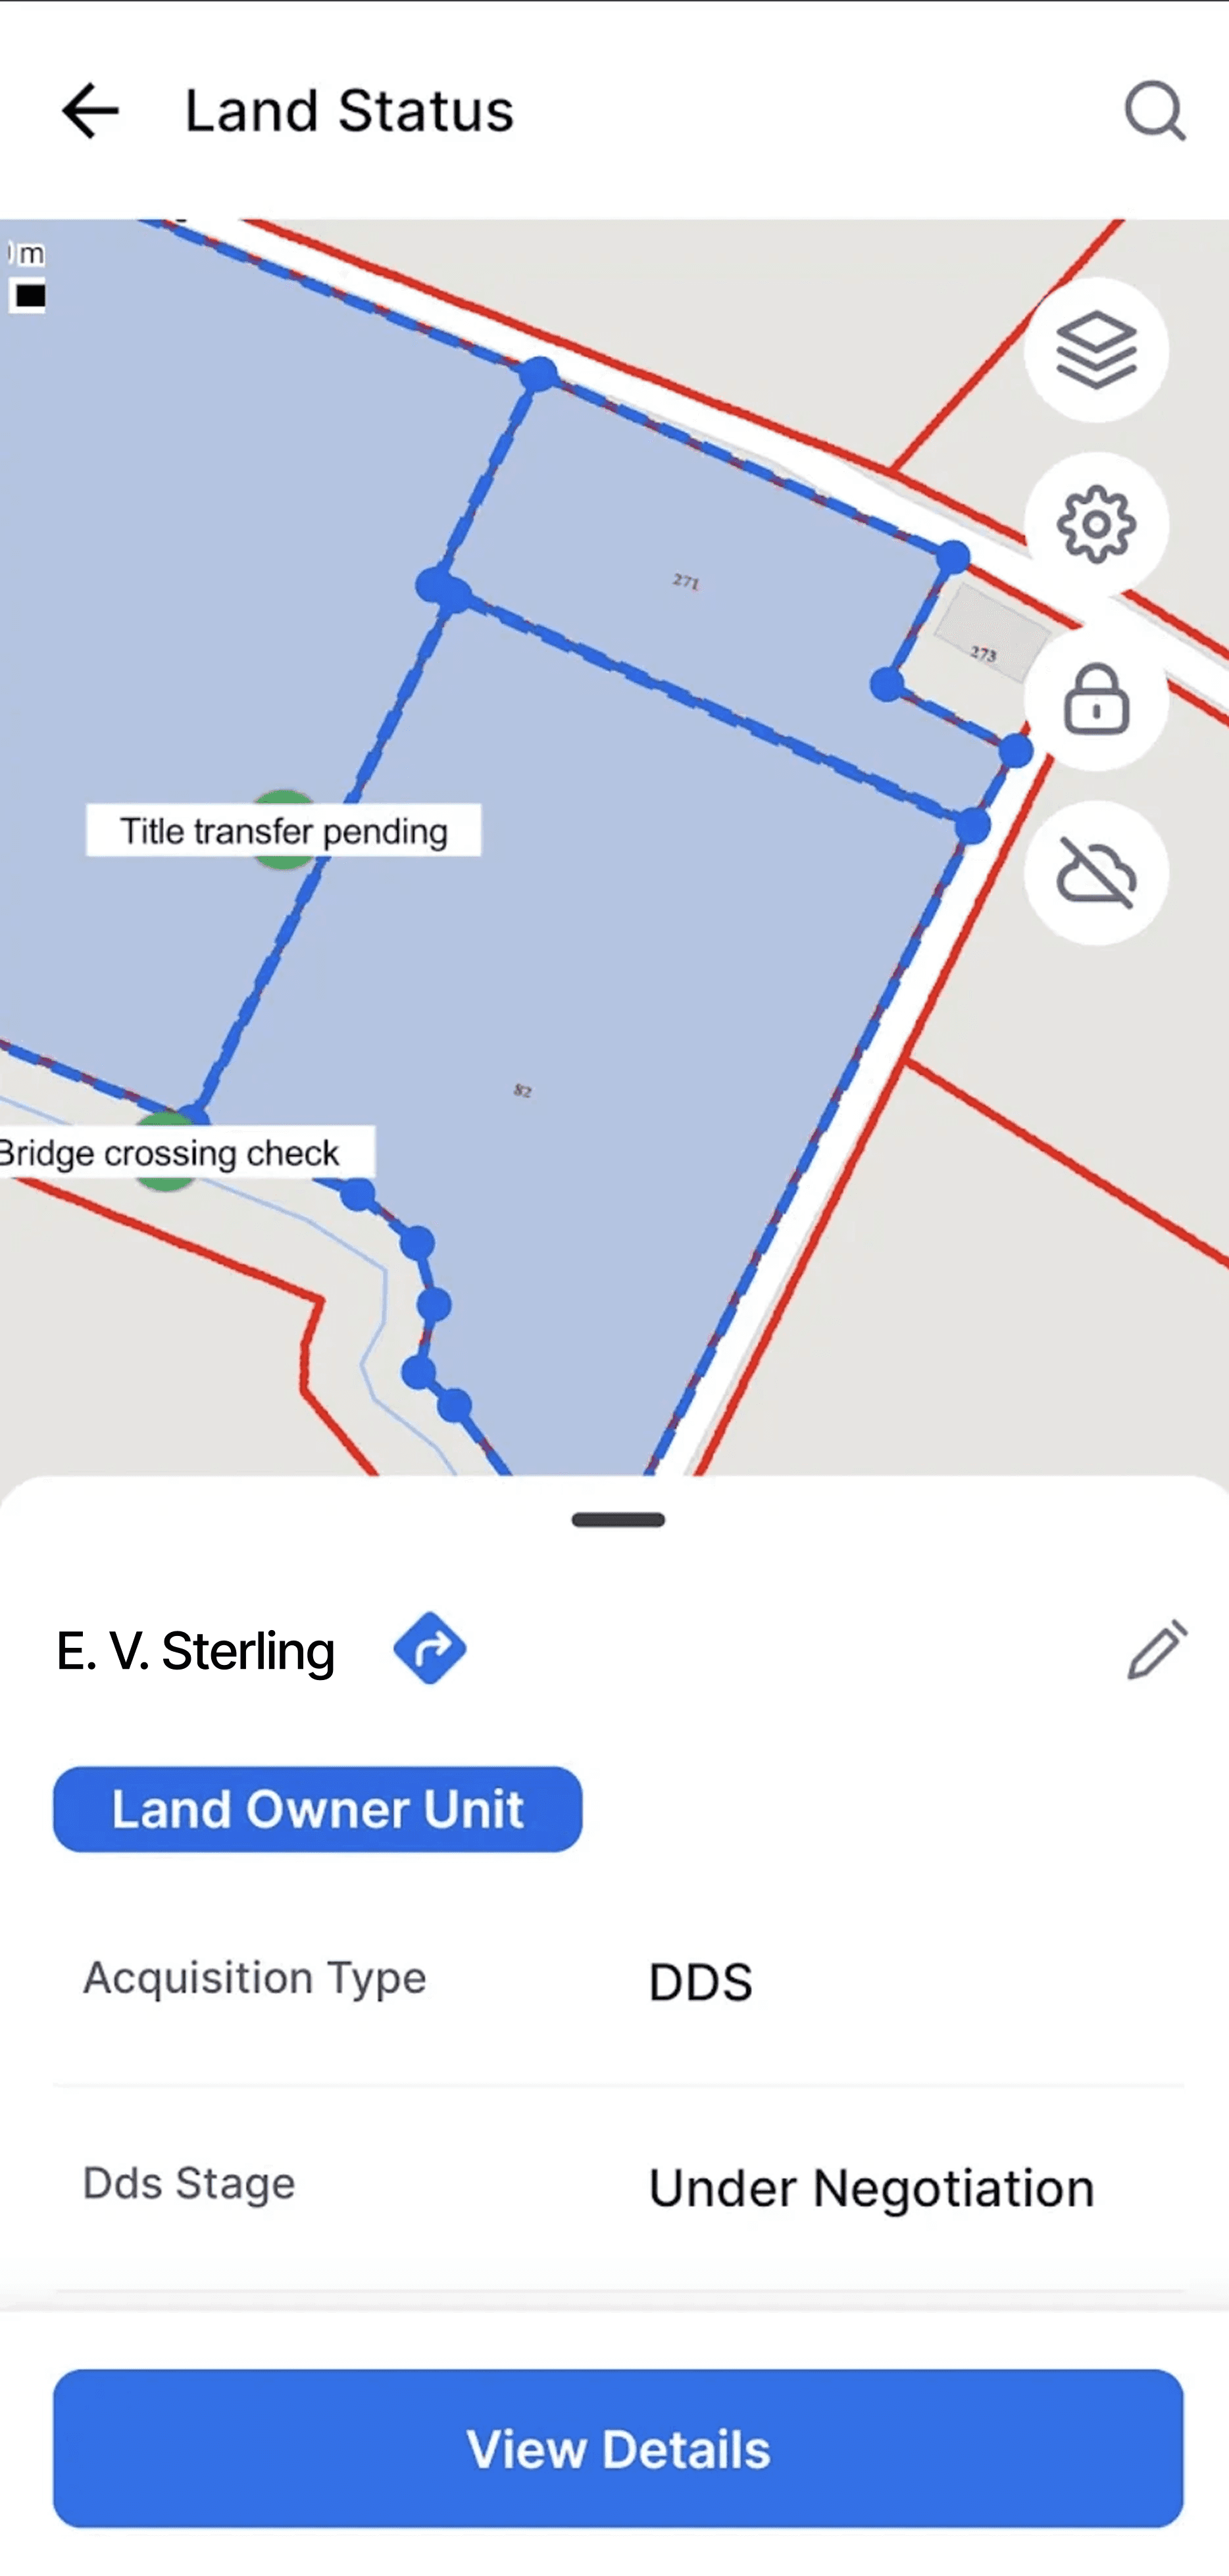
Map-Based Site Visibility

Unlike traditional project management tools, TaskMapper is built on a map. For wind projects, this means your site isn't just a list of tasks; it’s a living geospatial record.

Navigate the Vastness

Field teams can use the mobile app to navigate to specific turbine locations (WTGs) across complex terrain.

Navigate the Vastness

Field teams can use the mobile app to navigate to specific turbine locations (WTGs) across complex terrain.

Navigate the Vastness

Field teams can use the mobile app to navigate to specific turbine locations (WTGs) across complex terrain.

Layered Data

Overlay CAD designs, KML files, and drone orthomosaics. You can see exactly where an access road stands compared to the original design.

Layered Data

Overlay CAD designs, KML files, and drone orthomosaics. You can see exactly where an access road stands compared to the original design.

Layered Data

Overlay CAD designs, KML files, and drone orthomosaics. You can see exactly where an access road stands compared to the original design.

Visual Status

Turbine pads change colors on the map as they move from "Excavation" to "Rebar" to "Curing," giving stakeholders an instant visual of site progress.

Visual Status

Turbine pads change colors on the map as they move from "Excavation" to "Rebar" to "Curing," giving stakeholders an instant visual of site progress.

Digital twin

More than a Site Plan. A Living Digital Twin of Your Wind Farm

More than a Site Plan. A Living Digital Twin of Your Wind Farm

TaskMapper creates a relational hierarchy-connecting leases, turbine models, met towers, substations, and energy outputs in one system. That means every turbine serial number, blade inspection, met data, and substation component is tied to documents, permits, inspection reports, SCADA data, and maintenance history.

TaskMapper creates a relational hierarchy-connecting leases, turbine models, met towers, substations, and energy outputs in one system. That means every turbine serial number, blade inspection, met data, and substation component is tied to documents, permits, inspection reports, SCADA data, and maintenance history.

Spatial Twin

Bring together GIS layers, turbine and met-tower locations, bathymetry data, drone imagery, and construction site plans in an interactive, GIS-accurate geospatial view.
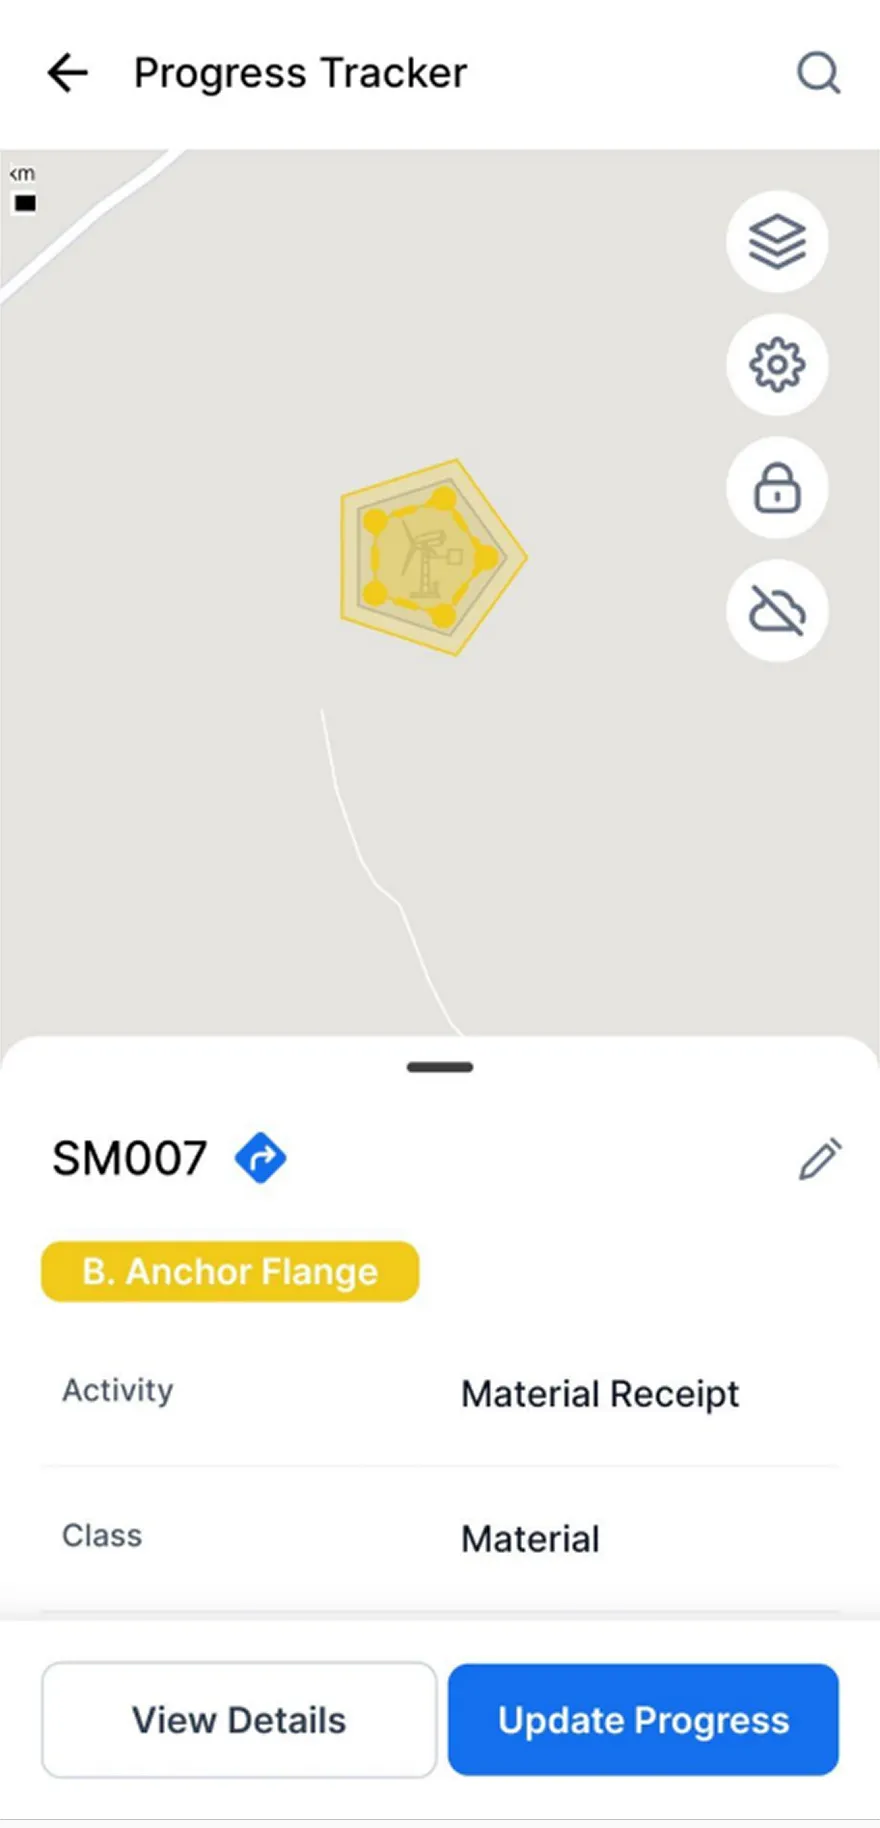
Project Asset Twin

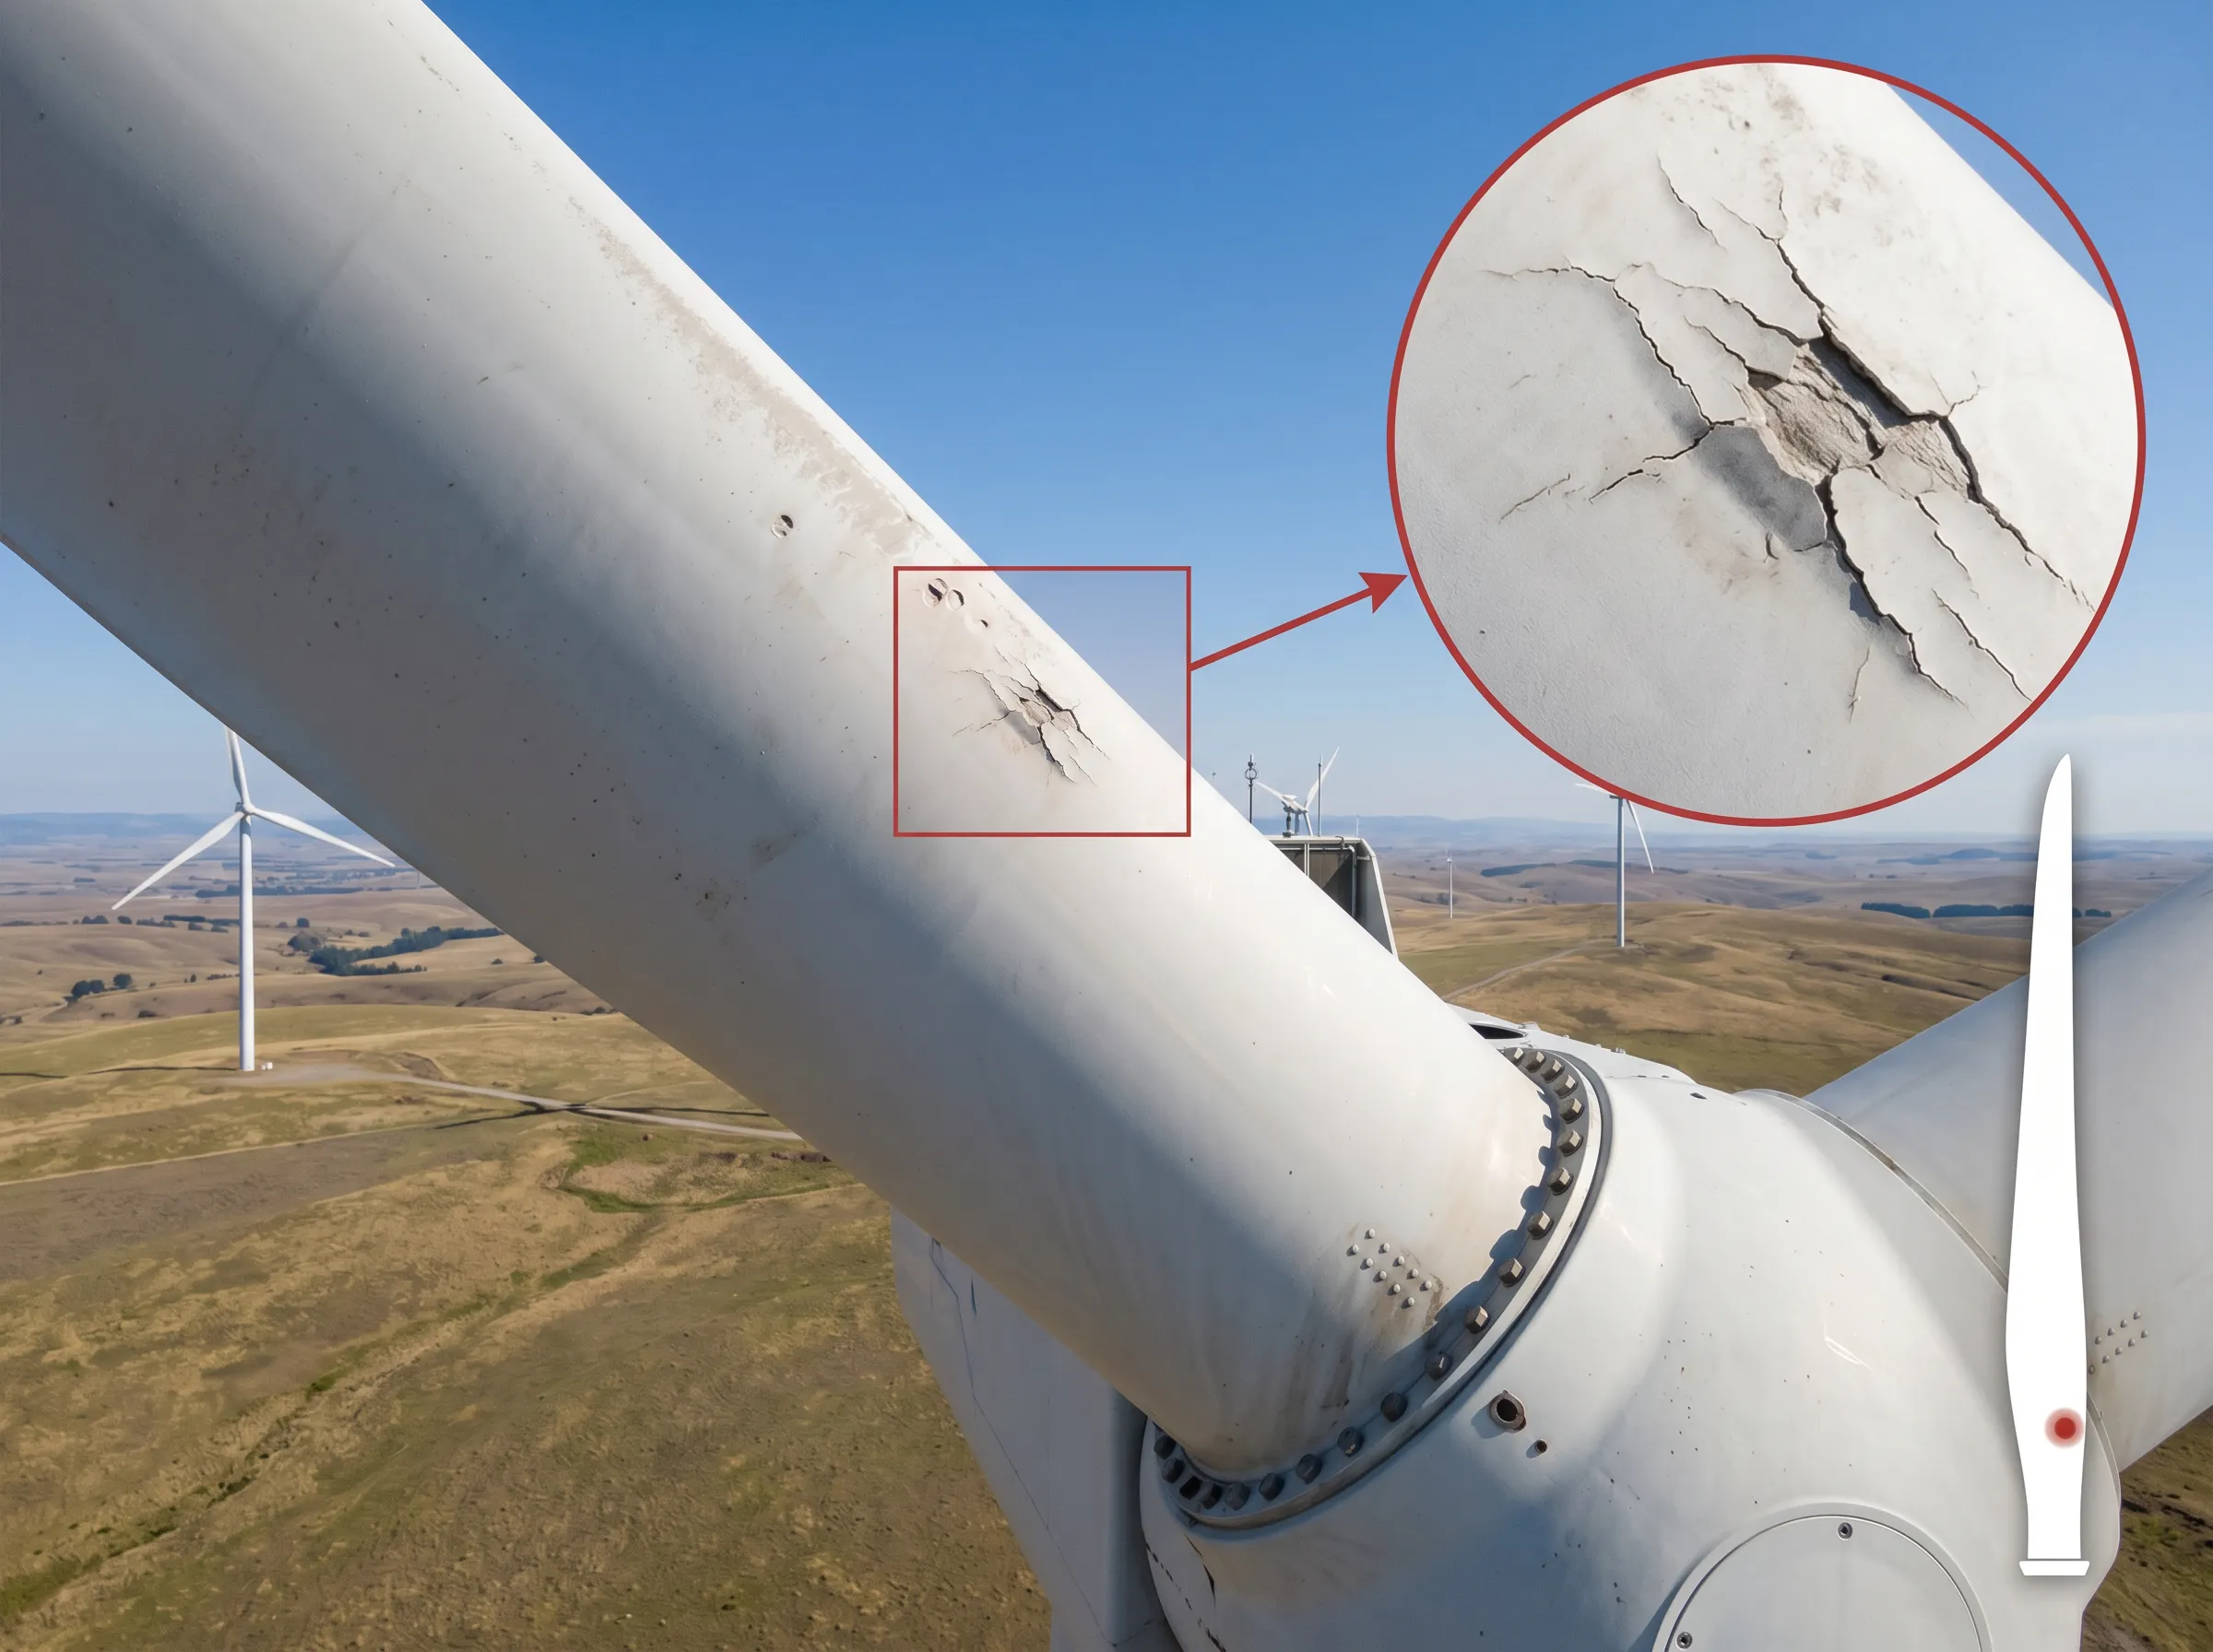
Track serialized components with warranties, blade serial numbers, gearbox health data, and met-data streams linked to each exact wind asset.
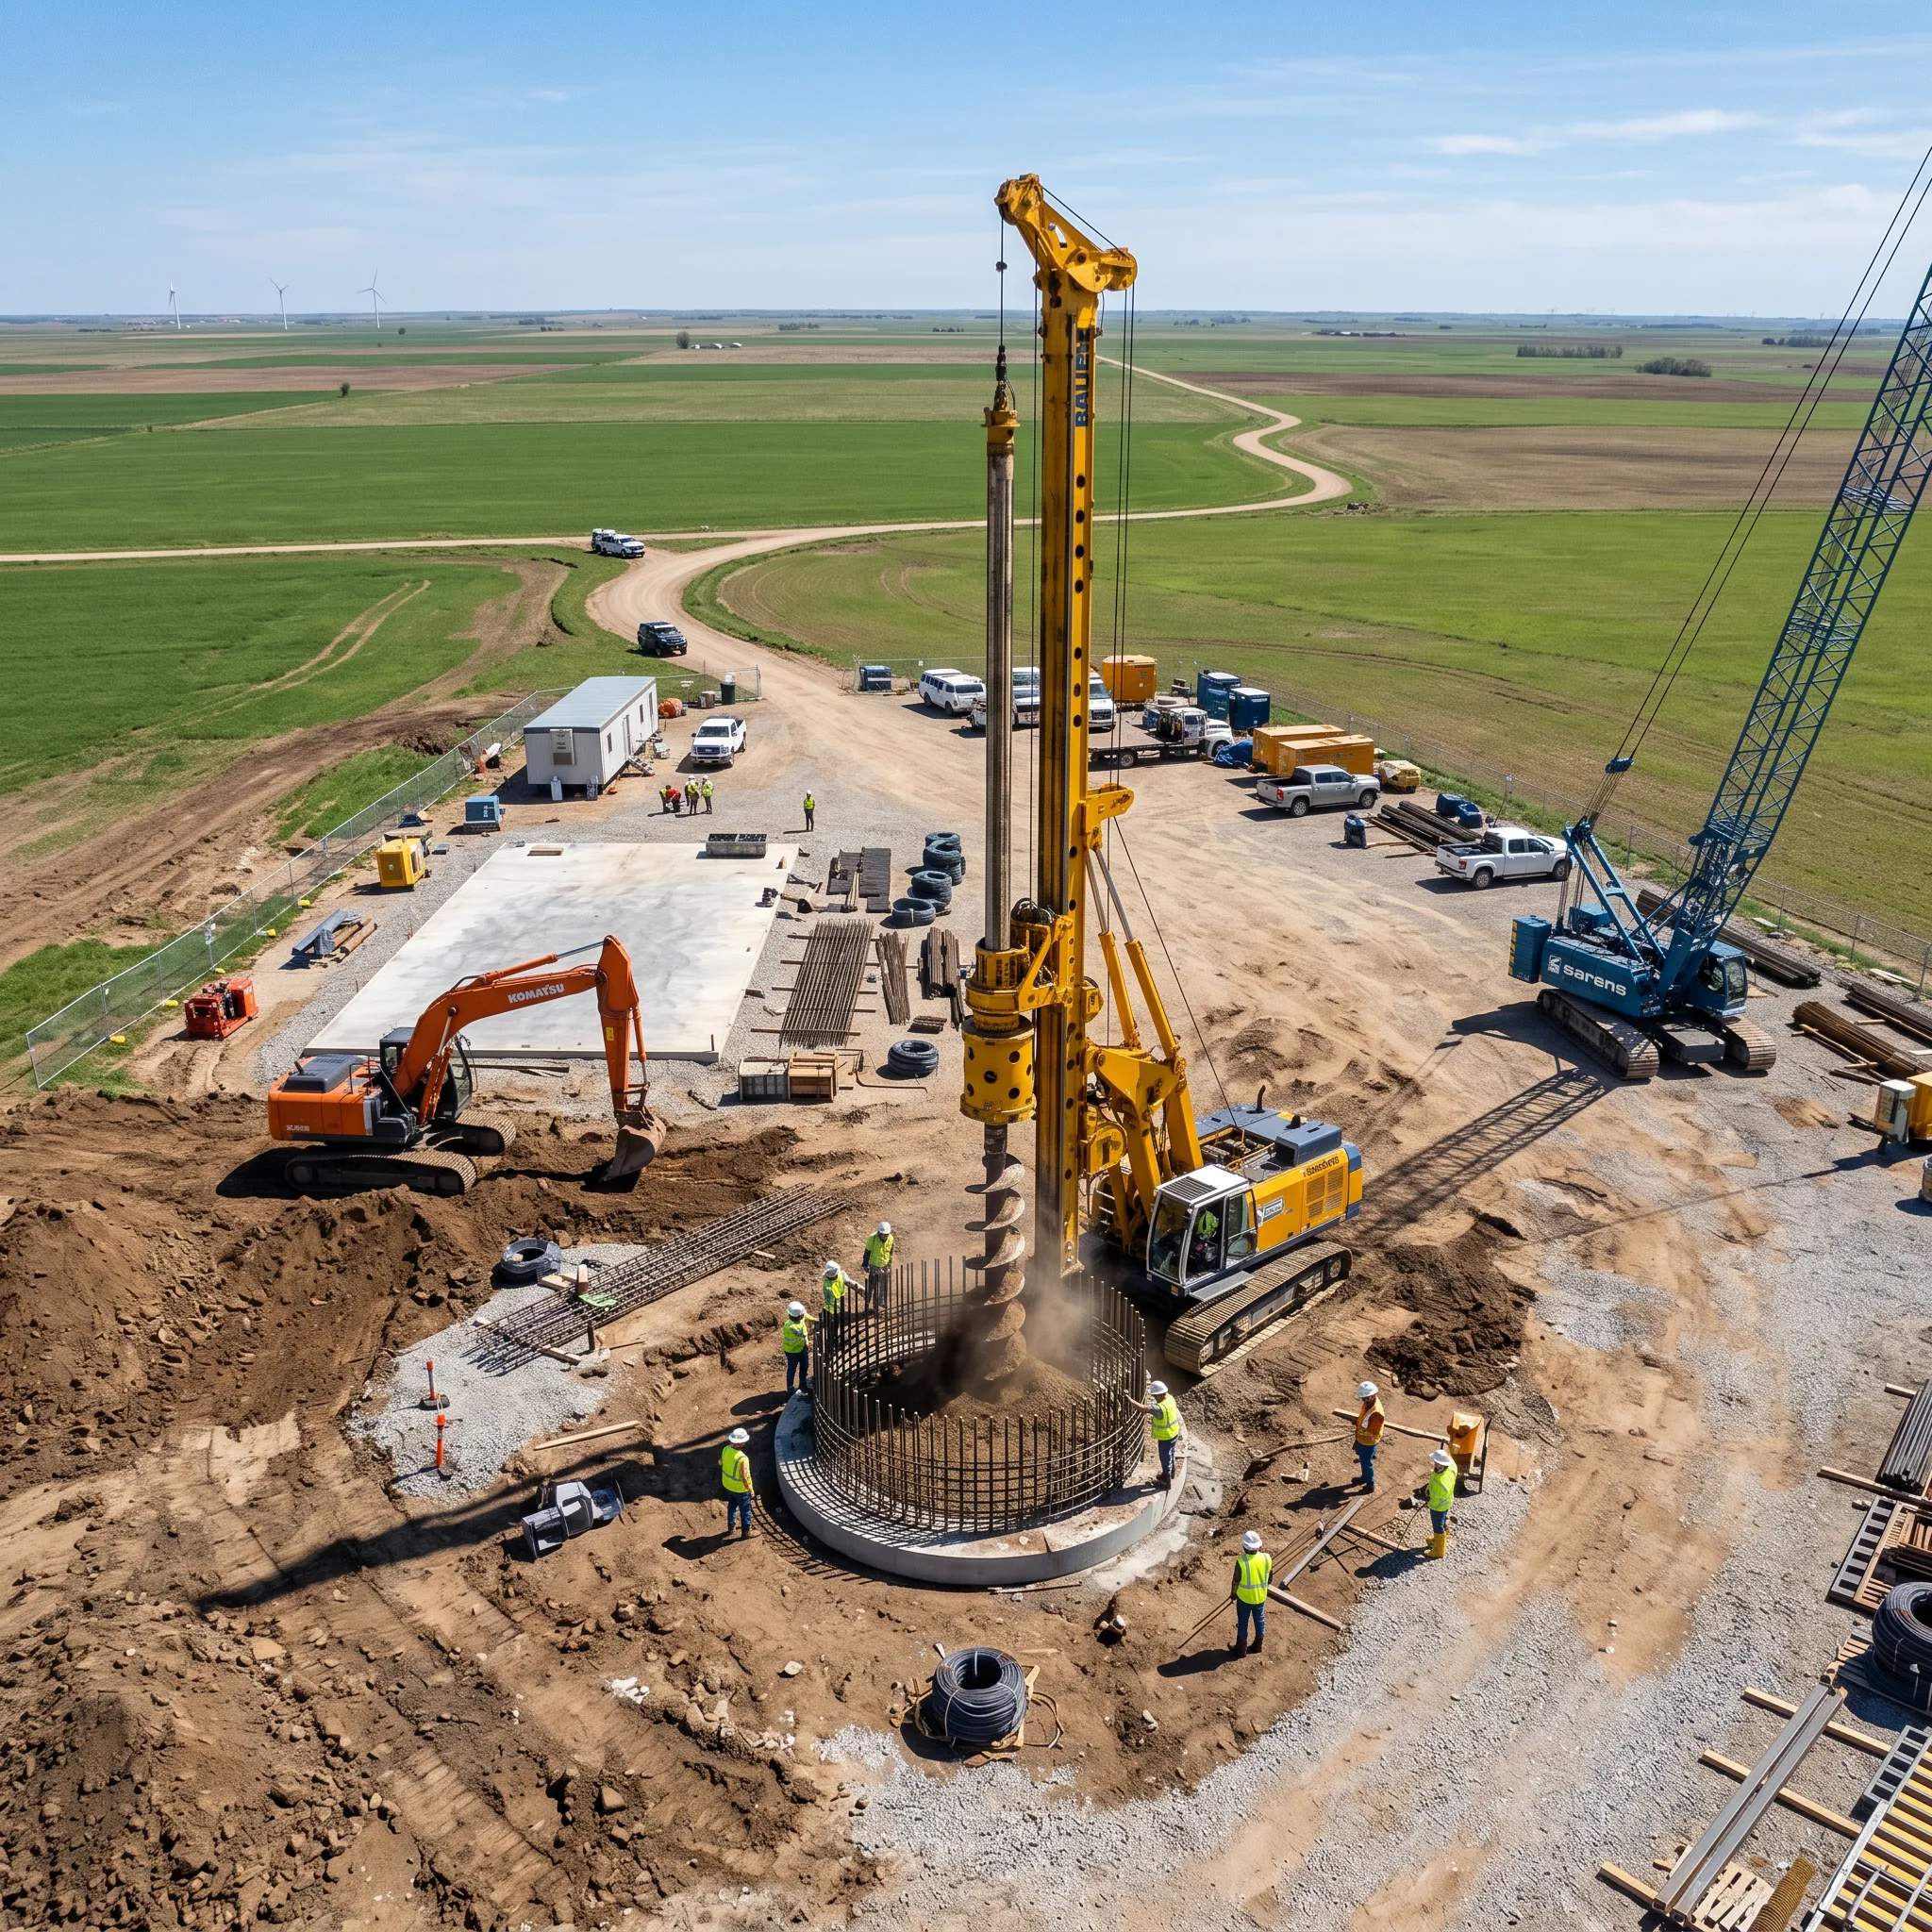
Process Twin

Digitize permit applications, foundation concrete tests, blade lifting protocols, and commissioning results-then connect those workflows directly to the precise turbine or asset on site.

Wind Construction Monitoring

Streamlining the “Big Three” of Wind Construction

Construction monitoring in wind focuses on three critical areas where TaskMapper excels:

Civil & Roads

Before the first turbine arrives, miles of access roads must be ready. TaskMapper tracks road compaction, drainage, and silt fence integrity using geo-located forms and drone audits.

Foundation Work

Mechanical & Electrical

Technician in safety gear using a surveying device and tablet displaying a solar farm layout map on a hillside site.

Field-to-Schedule

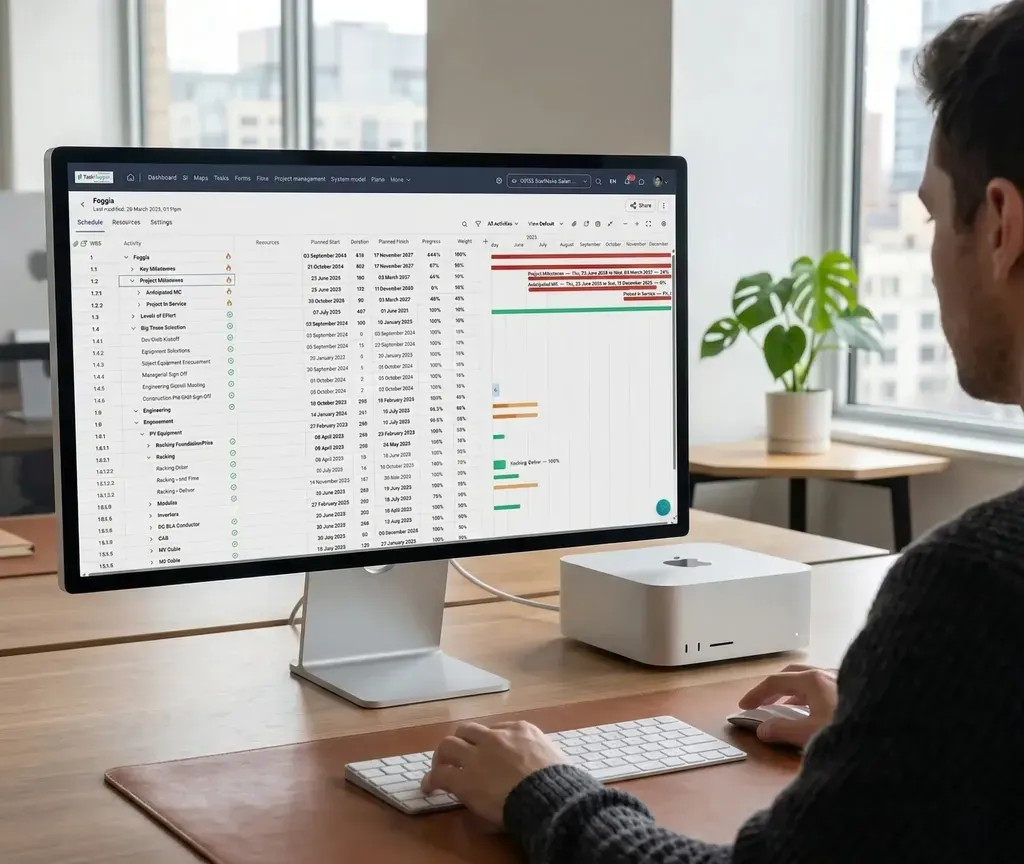
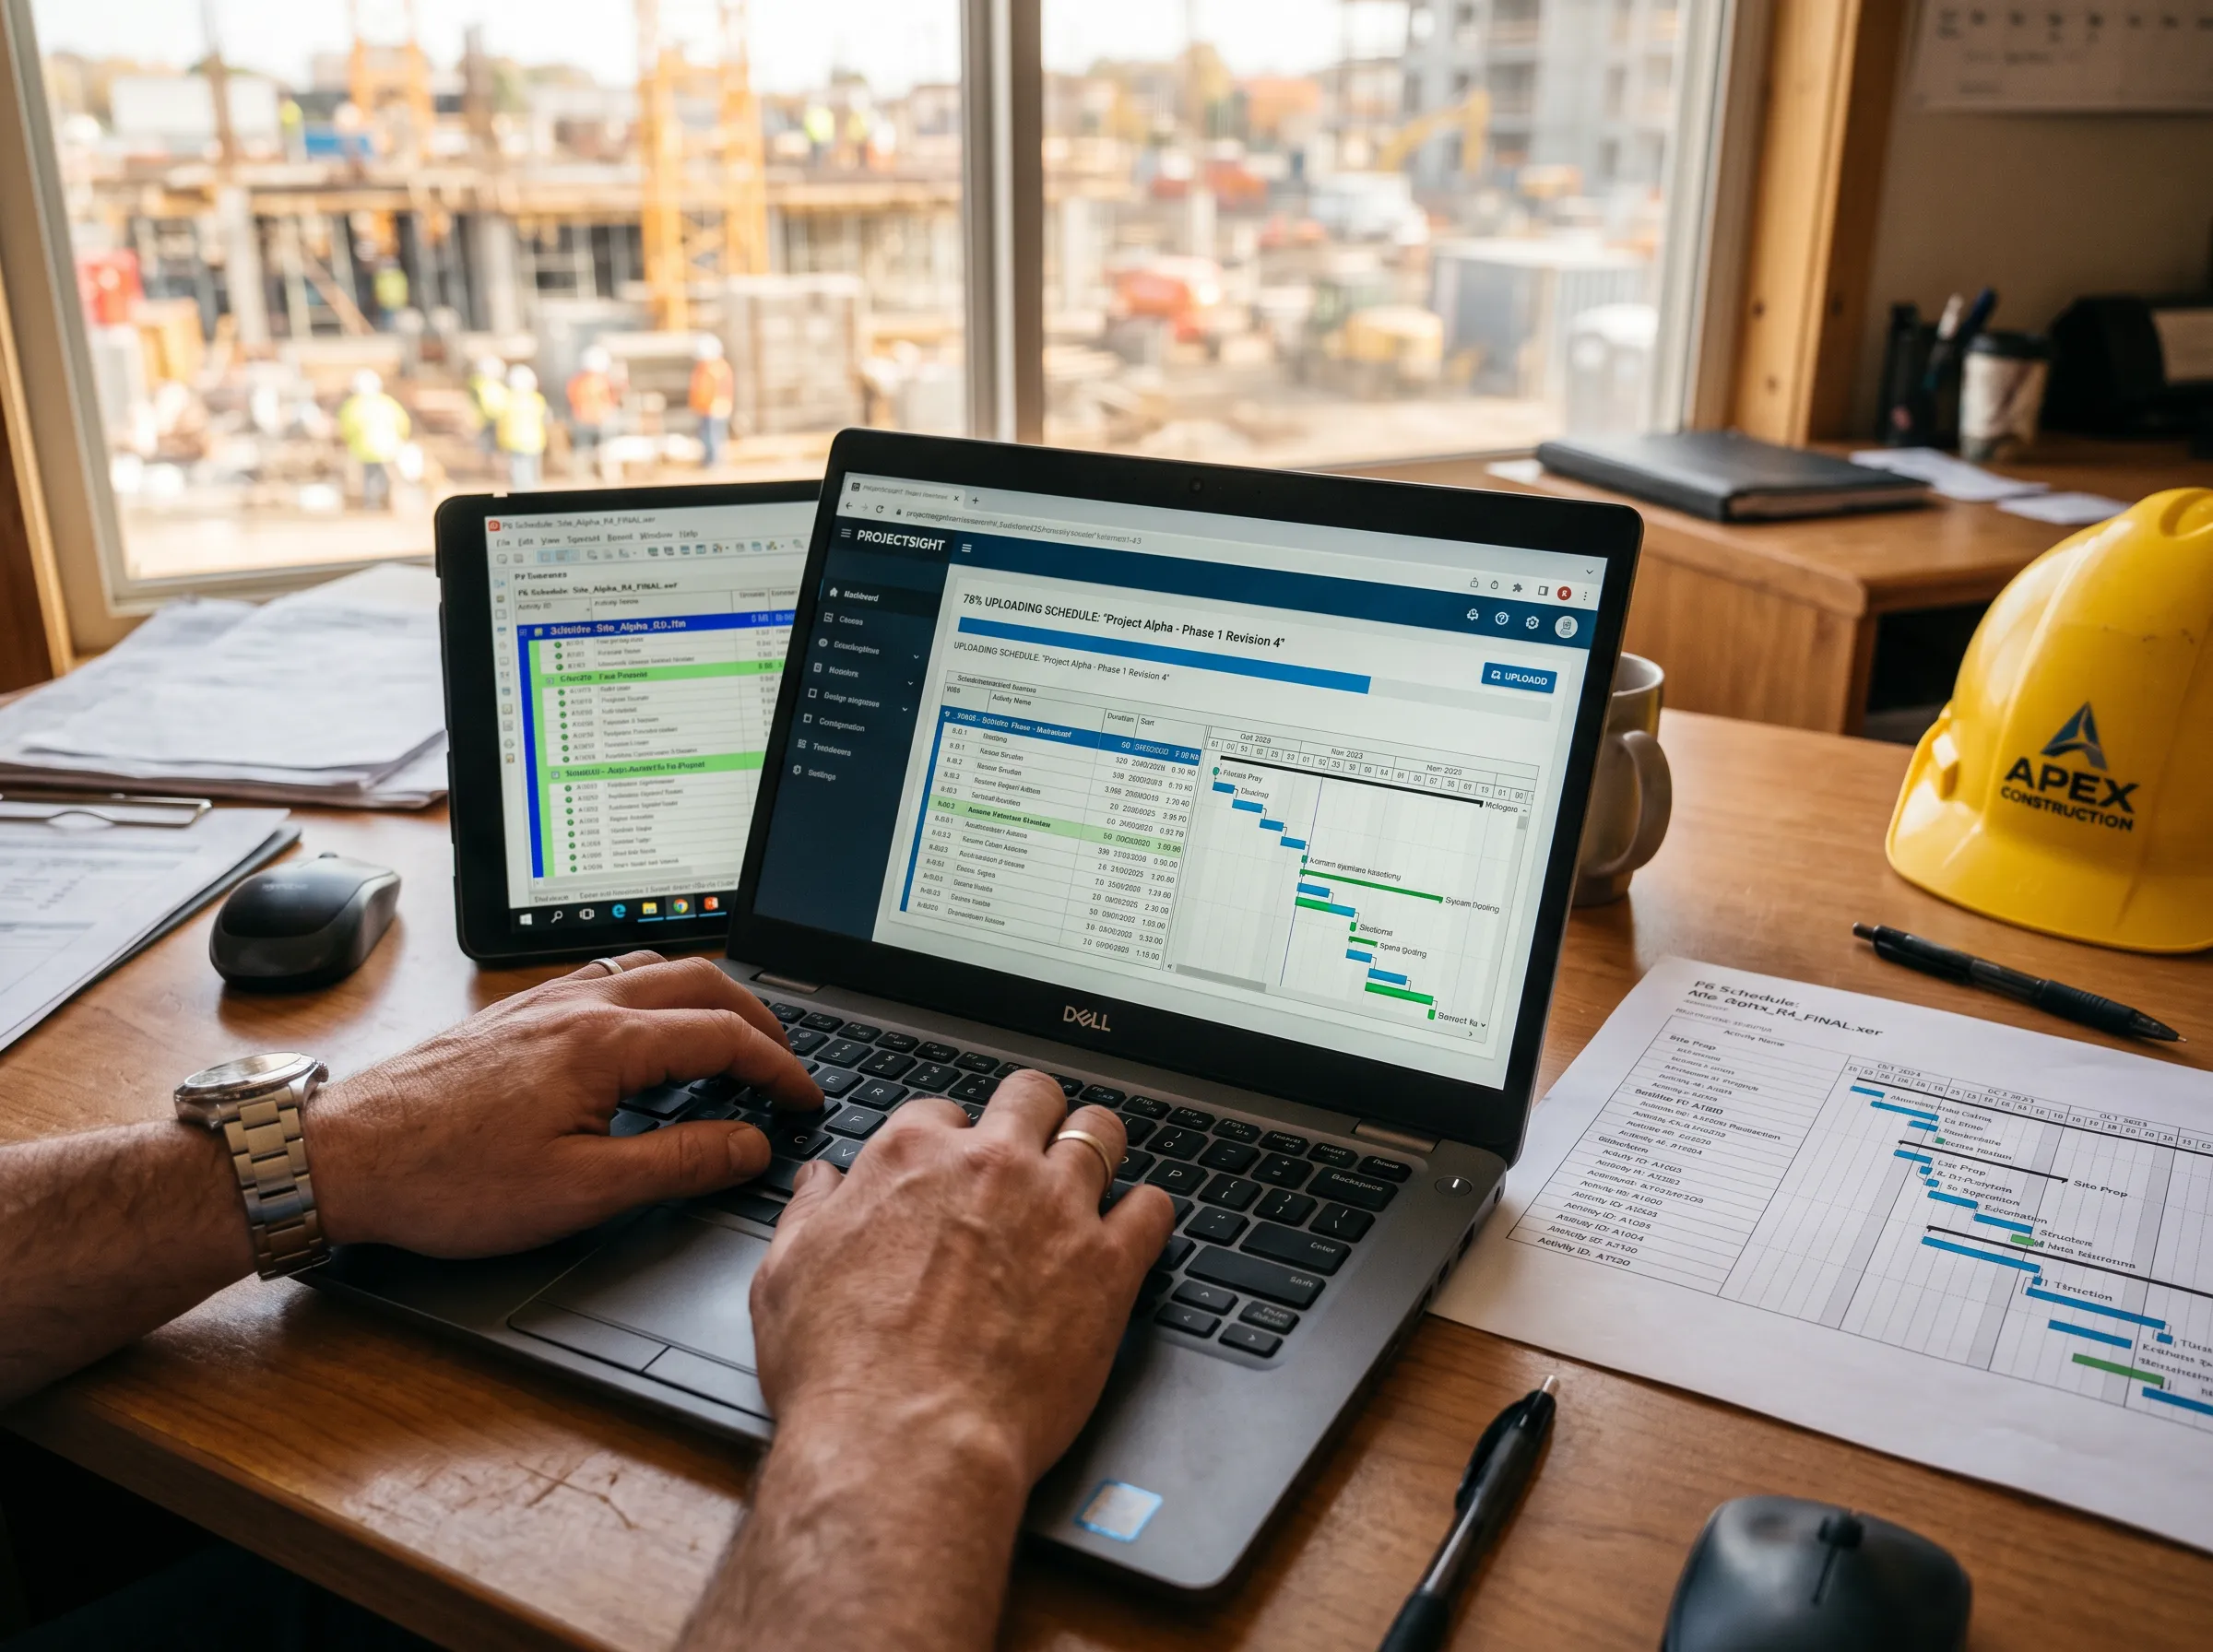
Closing the Gap: From Field Updates to Schedule Sync

The biggest headache for a Wind Project Manager is the Schedule Update. Typically, it takes days for field reports to be compiled into a Primavera (P6) or MS Project schedule. With TaskMapper, this happens in clicks, not days.

Person working on a laptop displaying project scheduling software at a construction site office, with documents and a hard hat on the desk and a construction site visible through the window.
Import Your Schedule

Upload your master project schedule (P6/XER or MS Project).

Import Your Schedule

Upload your master project schedule (P6/XER or MS Project).

Field-Linked Tasks

Field updates to specific turbine activities automatically feed into the schedule.

Field-Linked Tasks

Field updates to specific turbine activities automatically feed into the schedule.

Field-Linked Tasks

Field updates to specific turbine activities automatically feed into the schedule.

Construction worker wearing a hard hat and safety vest using a tablet at a wind turbine construction site, with cranes and equipment in the background.
Office workspace with dual monitors displaying wind farm project progress charts and scheduling data, with printed reports and a coffee cup on the desk.
Real-Time S-Curves

TaskMapper generates automated S-curves and progress dashboards. If the foundation team is lagging at WTG-12, you'll see the impact on your COD immediately.

Real-Time S-Curves

TaskMapper generates automated S-curves and progress dashboards. If the foundation team is lagging at WTG-12, you'll see the impact on your COD immediately.

Why SenseHawk

Built for Wind. Not Adapted for It.

Generic construction tools were never designed for utility-scale wind. See how SenseHawk compares where it matters most.

Feature
Description
TaskMapper
Generic CPM / PMIS
Spreadsheets
Wind Asset Twin Architecture
Structures vast, spread-out wind sites hierarchically from the substation up to foundations, towers, nacelles, and individual blades to track lifecycle milestones.
Yes(Native component links)
No(High-level milestone lists)
No(Flattened text entries)
Geospatial Micro-Siting Control
Overlays terrain data, crane pad layouts, and turbine center-points directly on a map to flag setback or grading errors instantly before construction.
Yes(Instant map validation)
No(Lengthy document RFI loops)
No(Completely blind to terrain)
Drone Blade & Tower QC Hub
Tethers high-resolution aerial inspection imagery and structural scan results directly to the specific turbine component's visual timeline.
Yes(Spatially mapped visual log)
No(Unsorted files in generic folders)
No(Cannot host heavy media)
Schedule-Linked Map Production
Integrates Primavera/MS Project schedules with the GIS map interface to automatically change turbine colors as work passes milestones.
Yes(Live 4D schedule map)
No(Gantt charts detached from GIS)
No(Requires manual updates)
No-Code Handover Checklists
Enforces multi-party sign-offs for foundation concrete pours and bolt torque steps using automated, visual workflow routing for QA/QC teams.
Yes(Visual flowchart engine)
Limited(Fixed structural templates)
No(Relies on manual email chase)
Custom Infrastructure BI Engine
Cross-references heavy equipment delivery timelines with real-time site assembly speeds via built-in SQL data querying.
Yes(SQL-capable engine built-in)
Limited(Broad financial rollups only)
Limited(Scattered, disconnected sheets)
NaaviX Generative AI Copilot
Answers conversational questions regarding spread-out regional assets (e.g., "Which wind turbine foundations are currently awaiting civil sign-off?")
Yes(Conversational site assistant)
No(Lacks intelligent semantic search)
No(Completely manual evaluation)
Feature
Description
TaskMapper
Generic CPM / PMIS
Spreadsheets
Wind Asset Twin Architecture
Structures vast, spread-out wind sites hierarchically from the substation up to foundations, towers, nacelles, and individual blades to track lifecycle milestones.
Yes(Native component links)
No(High-level milestone lists)
No(Flattened text entries)
Geospatial Micro-Siting Control
Overlays terrain data, crane pad layouts, and turbine center-points directly on a map to flag setback or grading errors instantly before construction.
Yes(Instant map validation)
No(Lengthy document RFI loops)
No(Completely blind to terrain)
Drone Blade & Tower QC Hub
Tethers high-resolution aerial inspection imagery and structural scan results directly to the specific turbine component's visual timeline.
Yes(Spatially mapped visual log)
No(Unsorted files in generic folders)
No(Cannot host heavy media)
Schedule-Linked Map Production
Integrates Primavera/MS Project schedules with the GIS map interface to automatically change turbine colors as work passes milestones.
Yes(Live 4D schedule map)
No(Gantt charts detached from GIS)
No(Requires manual updates)
No-Code Handover Checklists
Enforces multi-party sign-offs for foundation concrete pours and bolt torque steps using automated, visual workflow routing for QA/QC teams.
Yes(Visual flowchart engine)
Limited(Fixed structural templates)
No(Relies on manual email chase)
Custom Infrastructure BI Engine
Answers conversational questions regarding spread-out regional assets (e.g., "Which wind turbine foundations are currently awaiting civil sign-off?").
Yes(Conversational site assistant)
No(Lacks intelligent semantic search)
Yes(Completely manual evaluation)

Team Collaboration

Better Collaboration Between EPCs and Owners

Wind projects involve a "village" of contractors. TaskMapper acts as the Single Source of Truth

Contextual Chat

Teams can chat within a specific task (e.g., "Crane delay at Pad 5") so the conversation is always linked to the location and the problem.

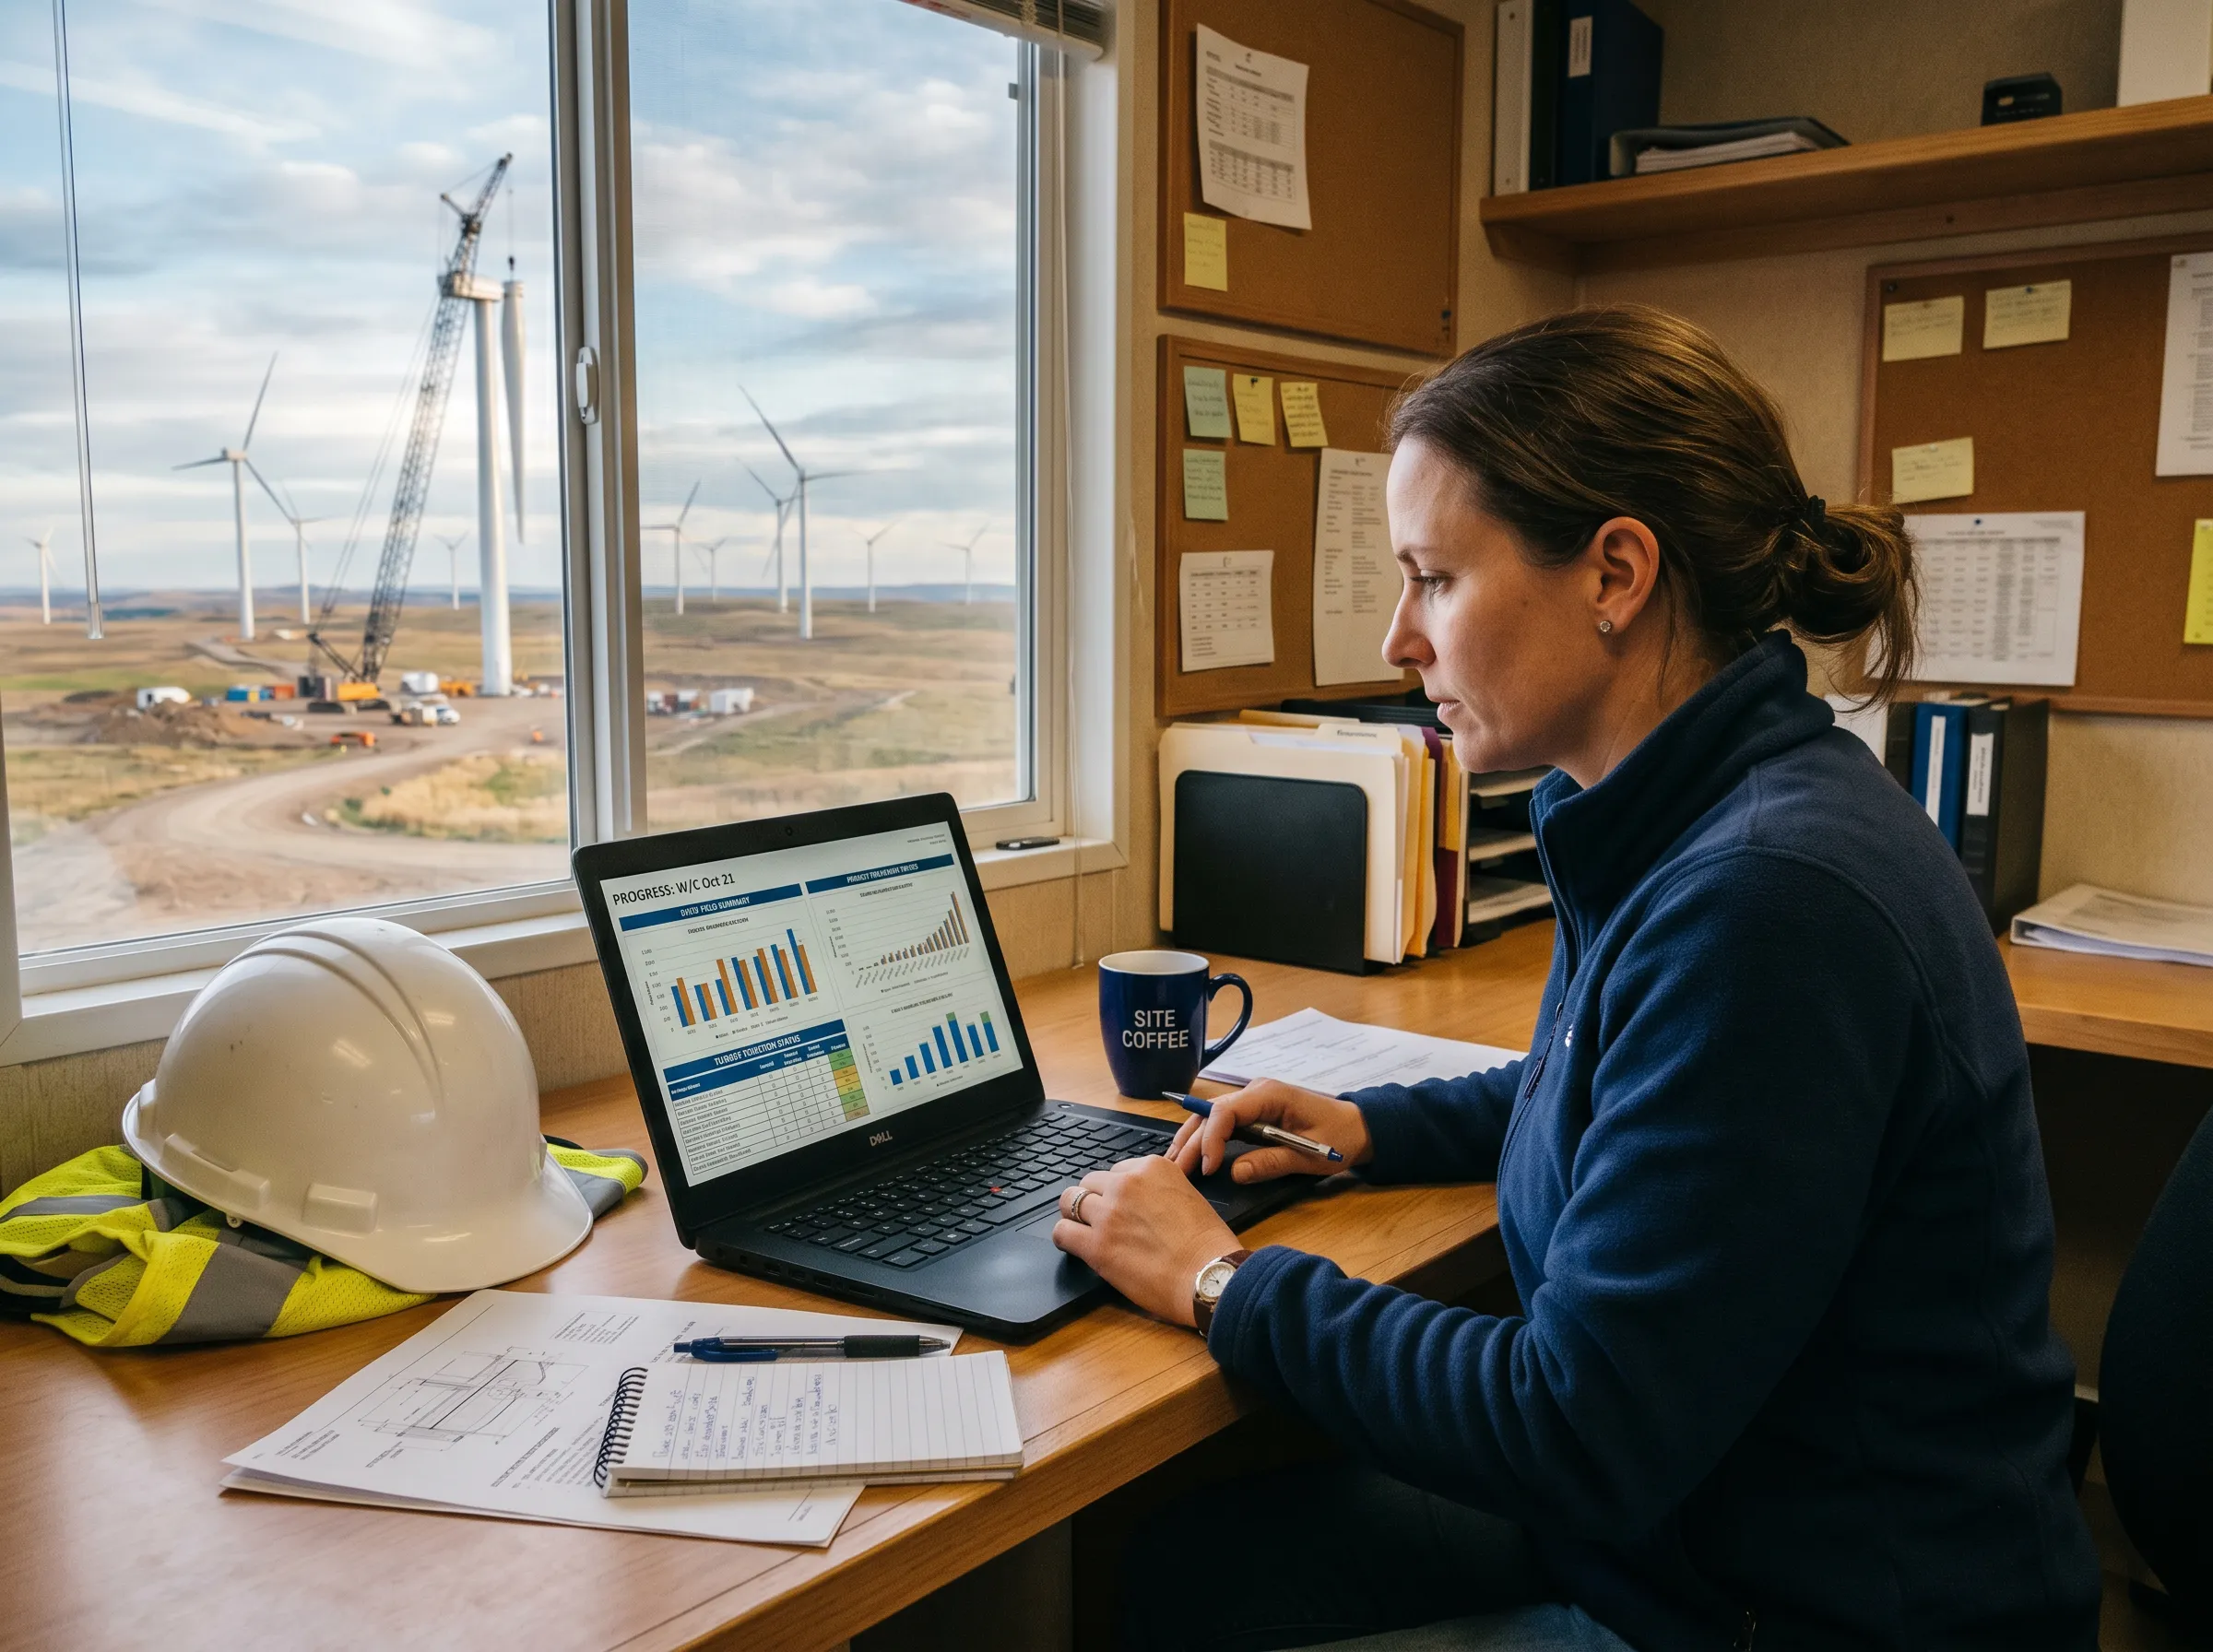
Automated Daily Progress Reports (DPRs)

Instead of superintendents spending two hours every evening on paperwork, TaskMapper aggregates daily field data into a professional PDF report in minutes.

Outcomes

What Wind Energy Teams Get with TaskMapper

What Wind Energy Teams Get with TaskMapper

See how wind energy teams transform project execution with real-time visibility, streamlined workflows, and data-driven decision-making using TaskMapper.

See how wind energy teams transform project execution with real-time visibility, streamlined workflows, and data-driven decision-making using TaskMapper.

Reduce delays with proactive alerts and real-time geospatial tracking of turbine installation and site progress.

Cut rework and ensure compliance through digital QA/QC forms, standardized checklists (e.g., foundation, tower), and geo-tagged evidence.

Accelerate wind farm commissioning with real-time data and faster digital testing workflows.

Optimize asset management with end-to-end traceability of turbine components (blades, nacelles, towers) to prevent idle crews.

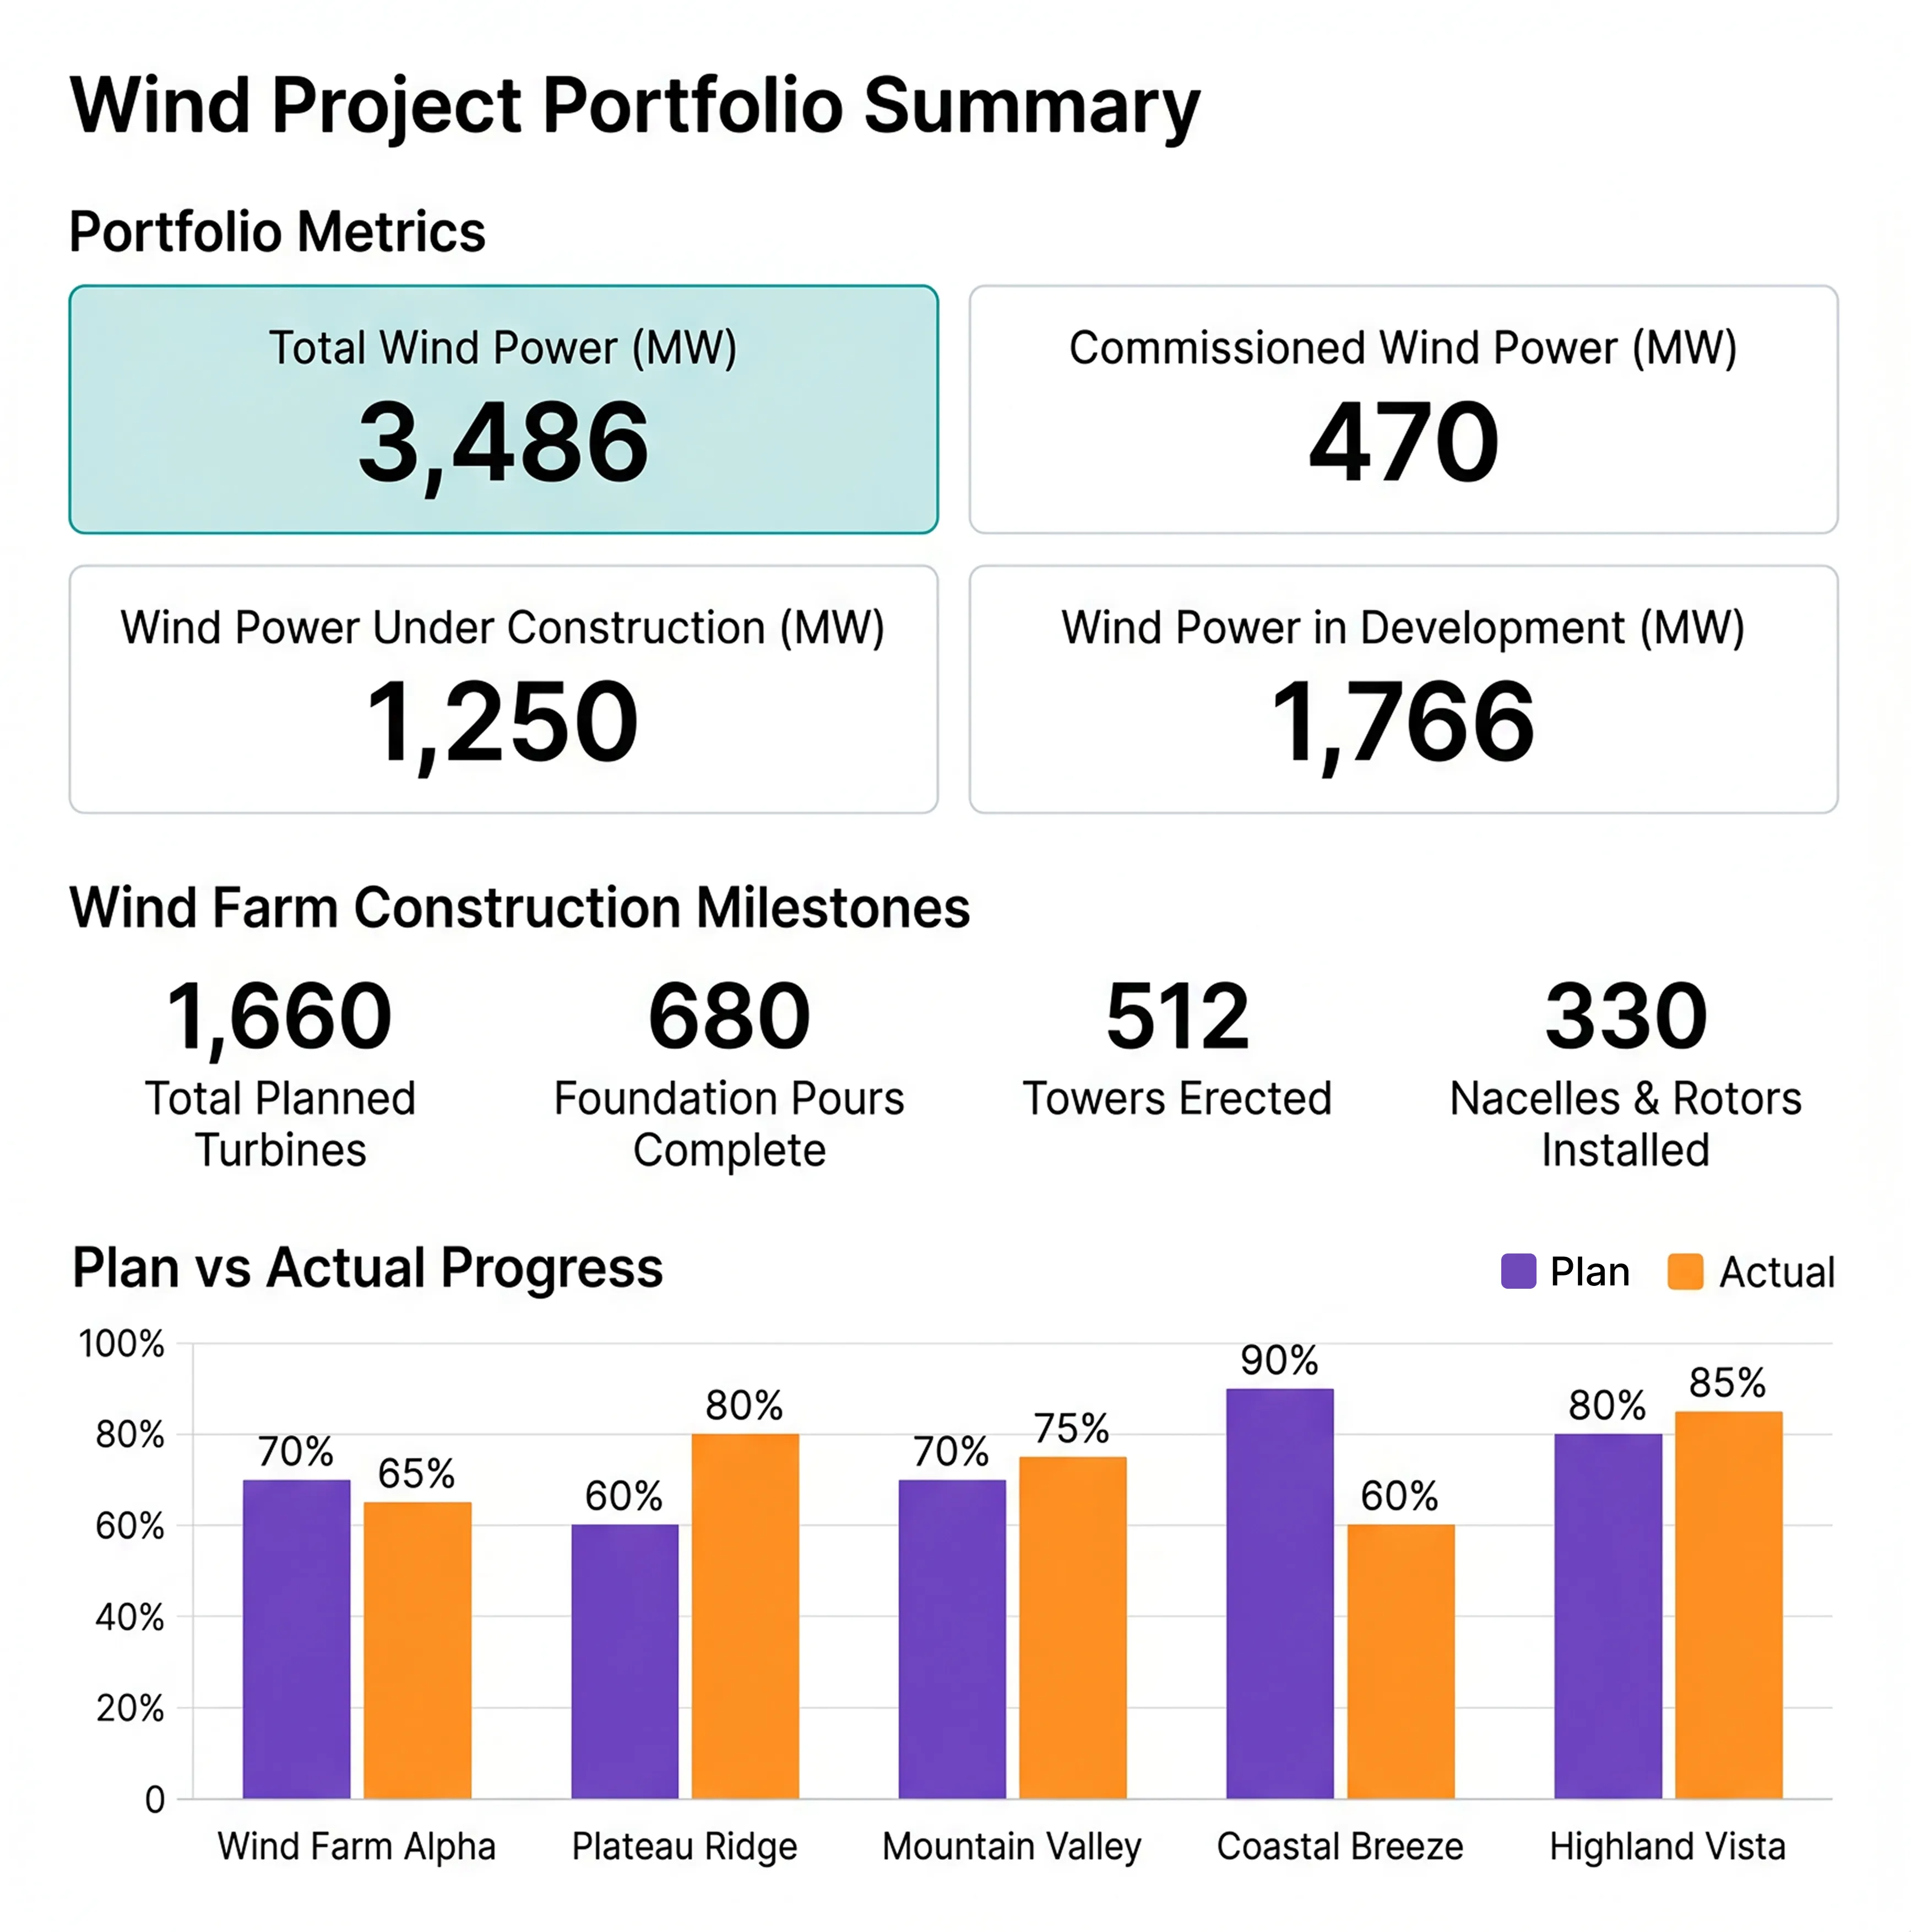
Make better portfolio decisions with live dashboards, master schedule integration, and AI-driven insights.

Team in a solar company meeting reviewing project performance dashboards and analytics with solar panels visible outside.
Engineer monitoring solar farm performance analytics and project data on dual screens in a site office overlooking solar panels.

Mobile + AI

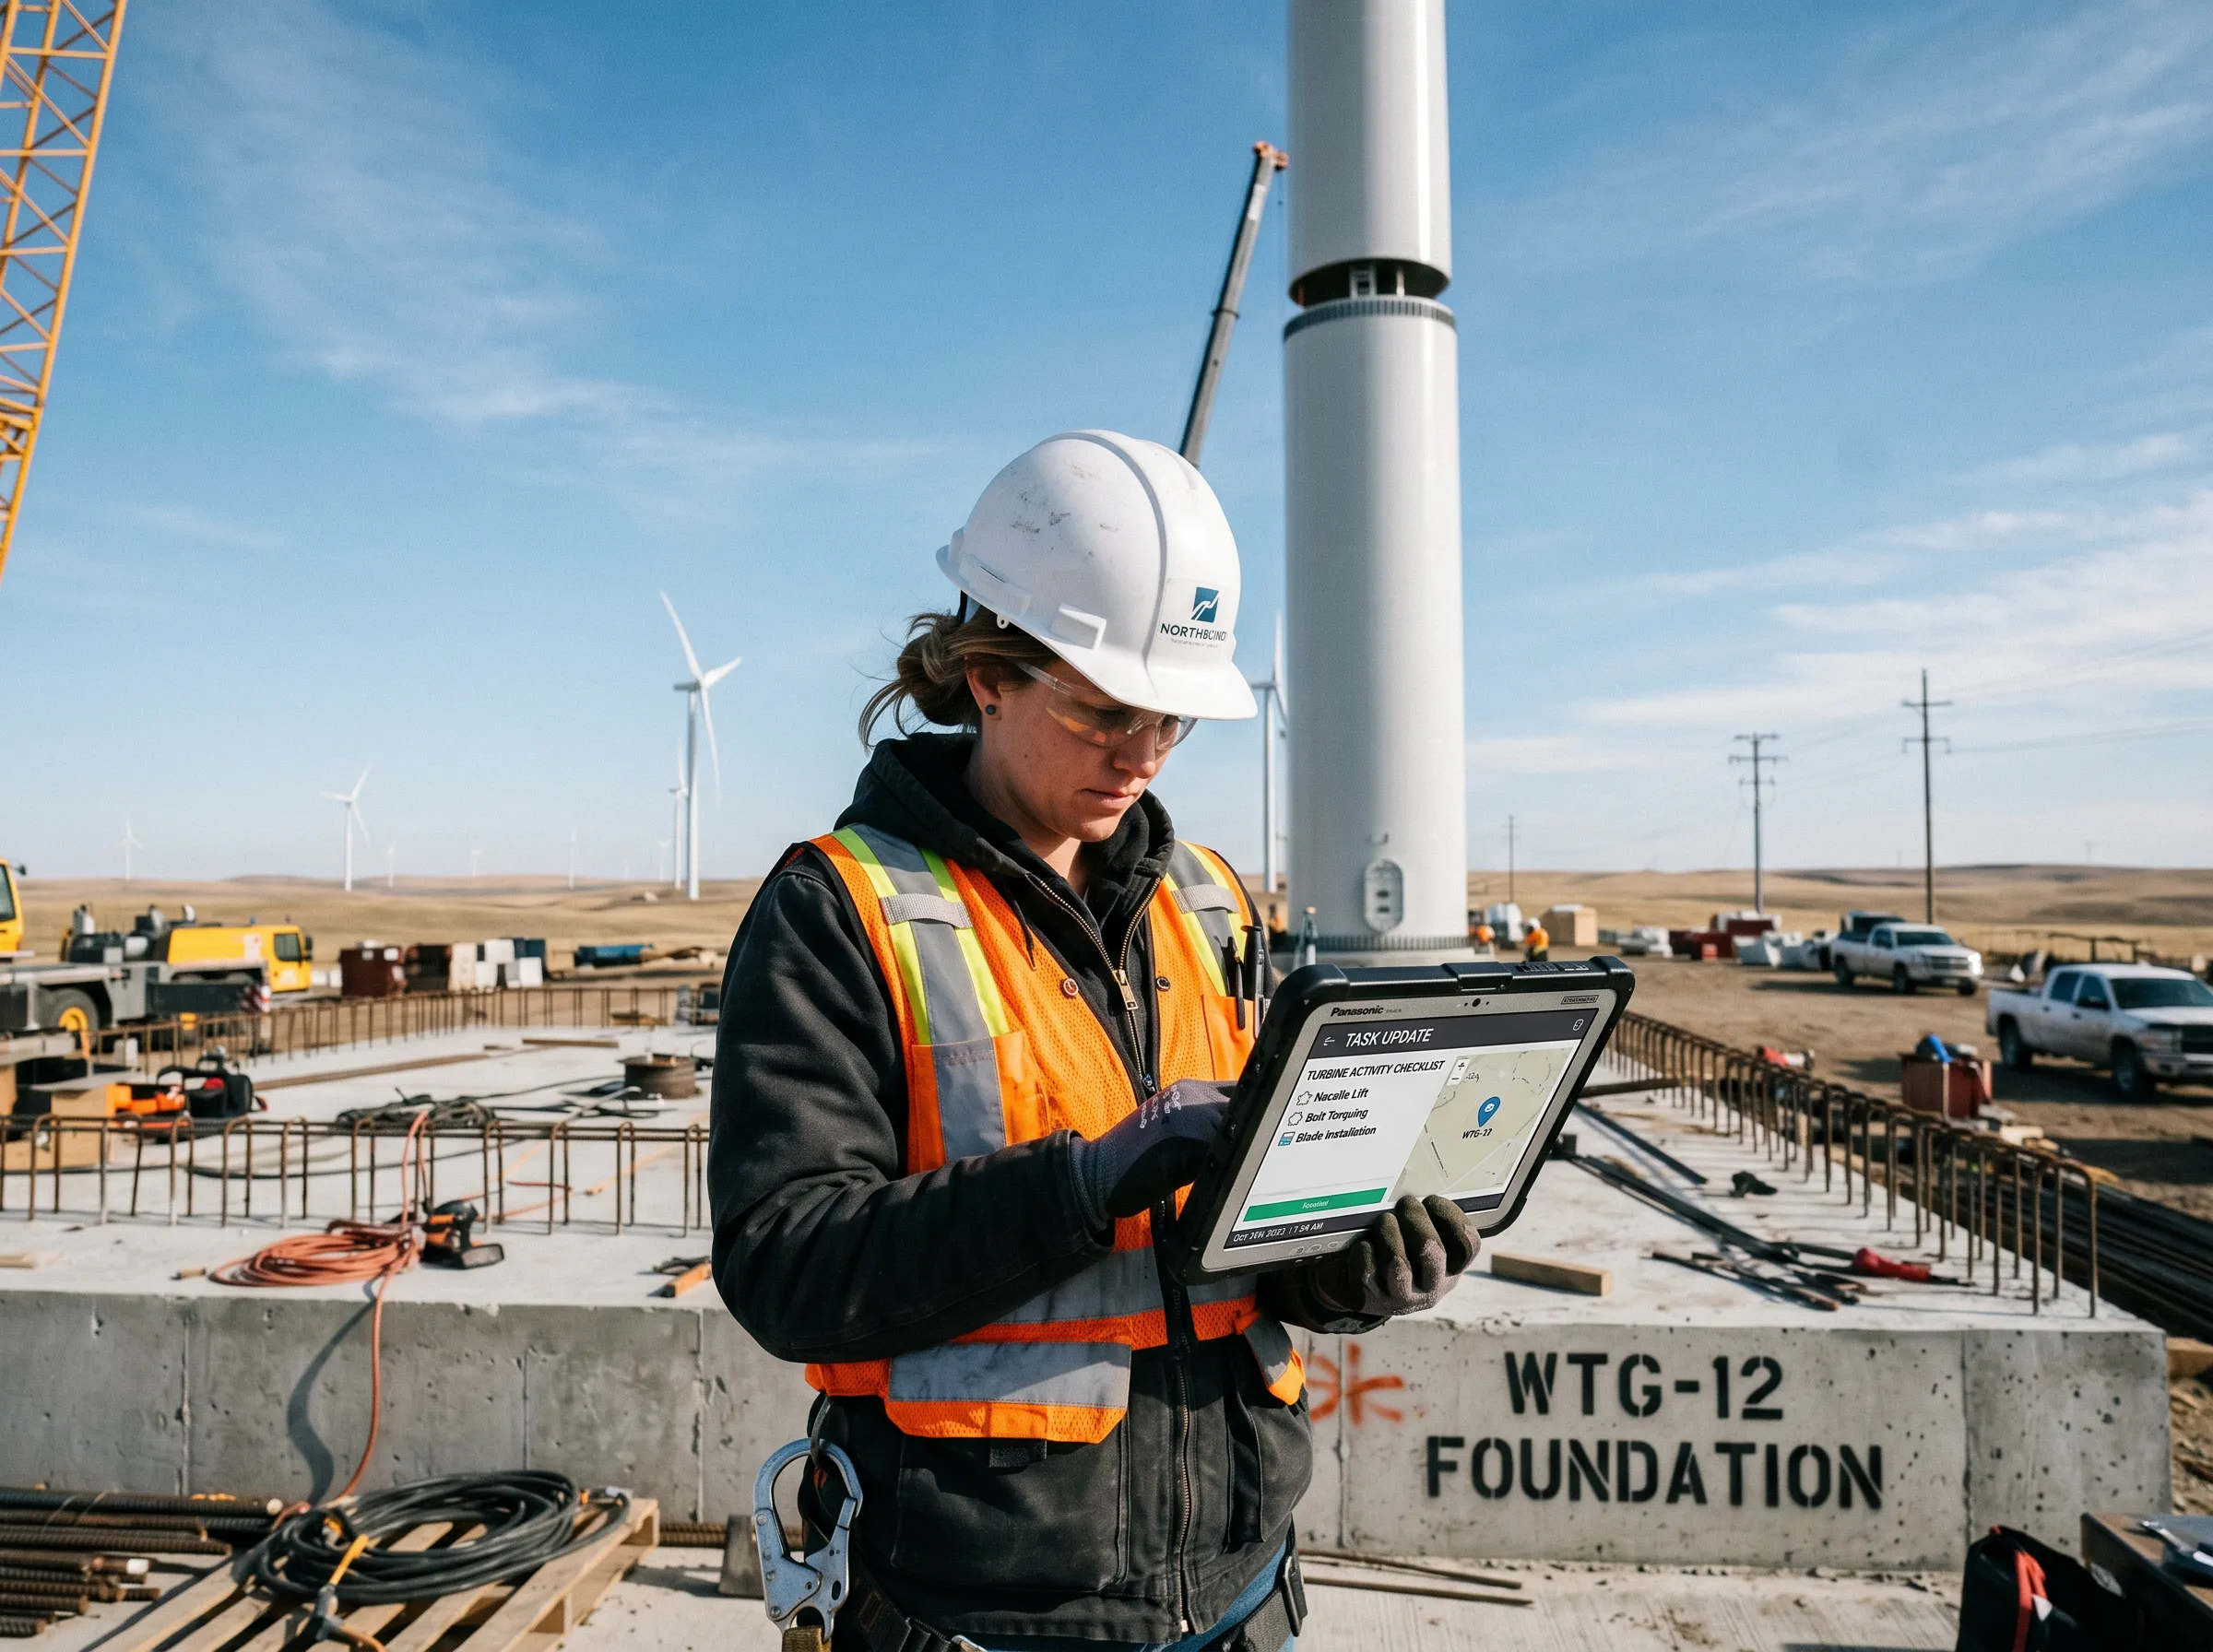
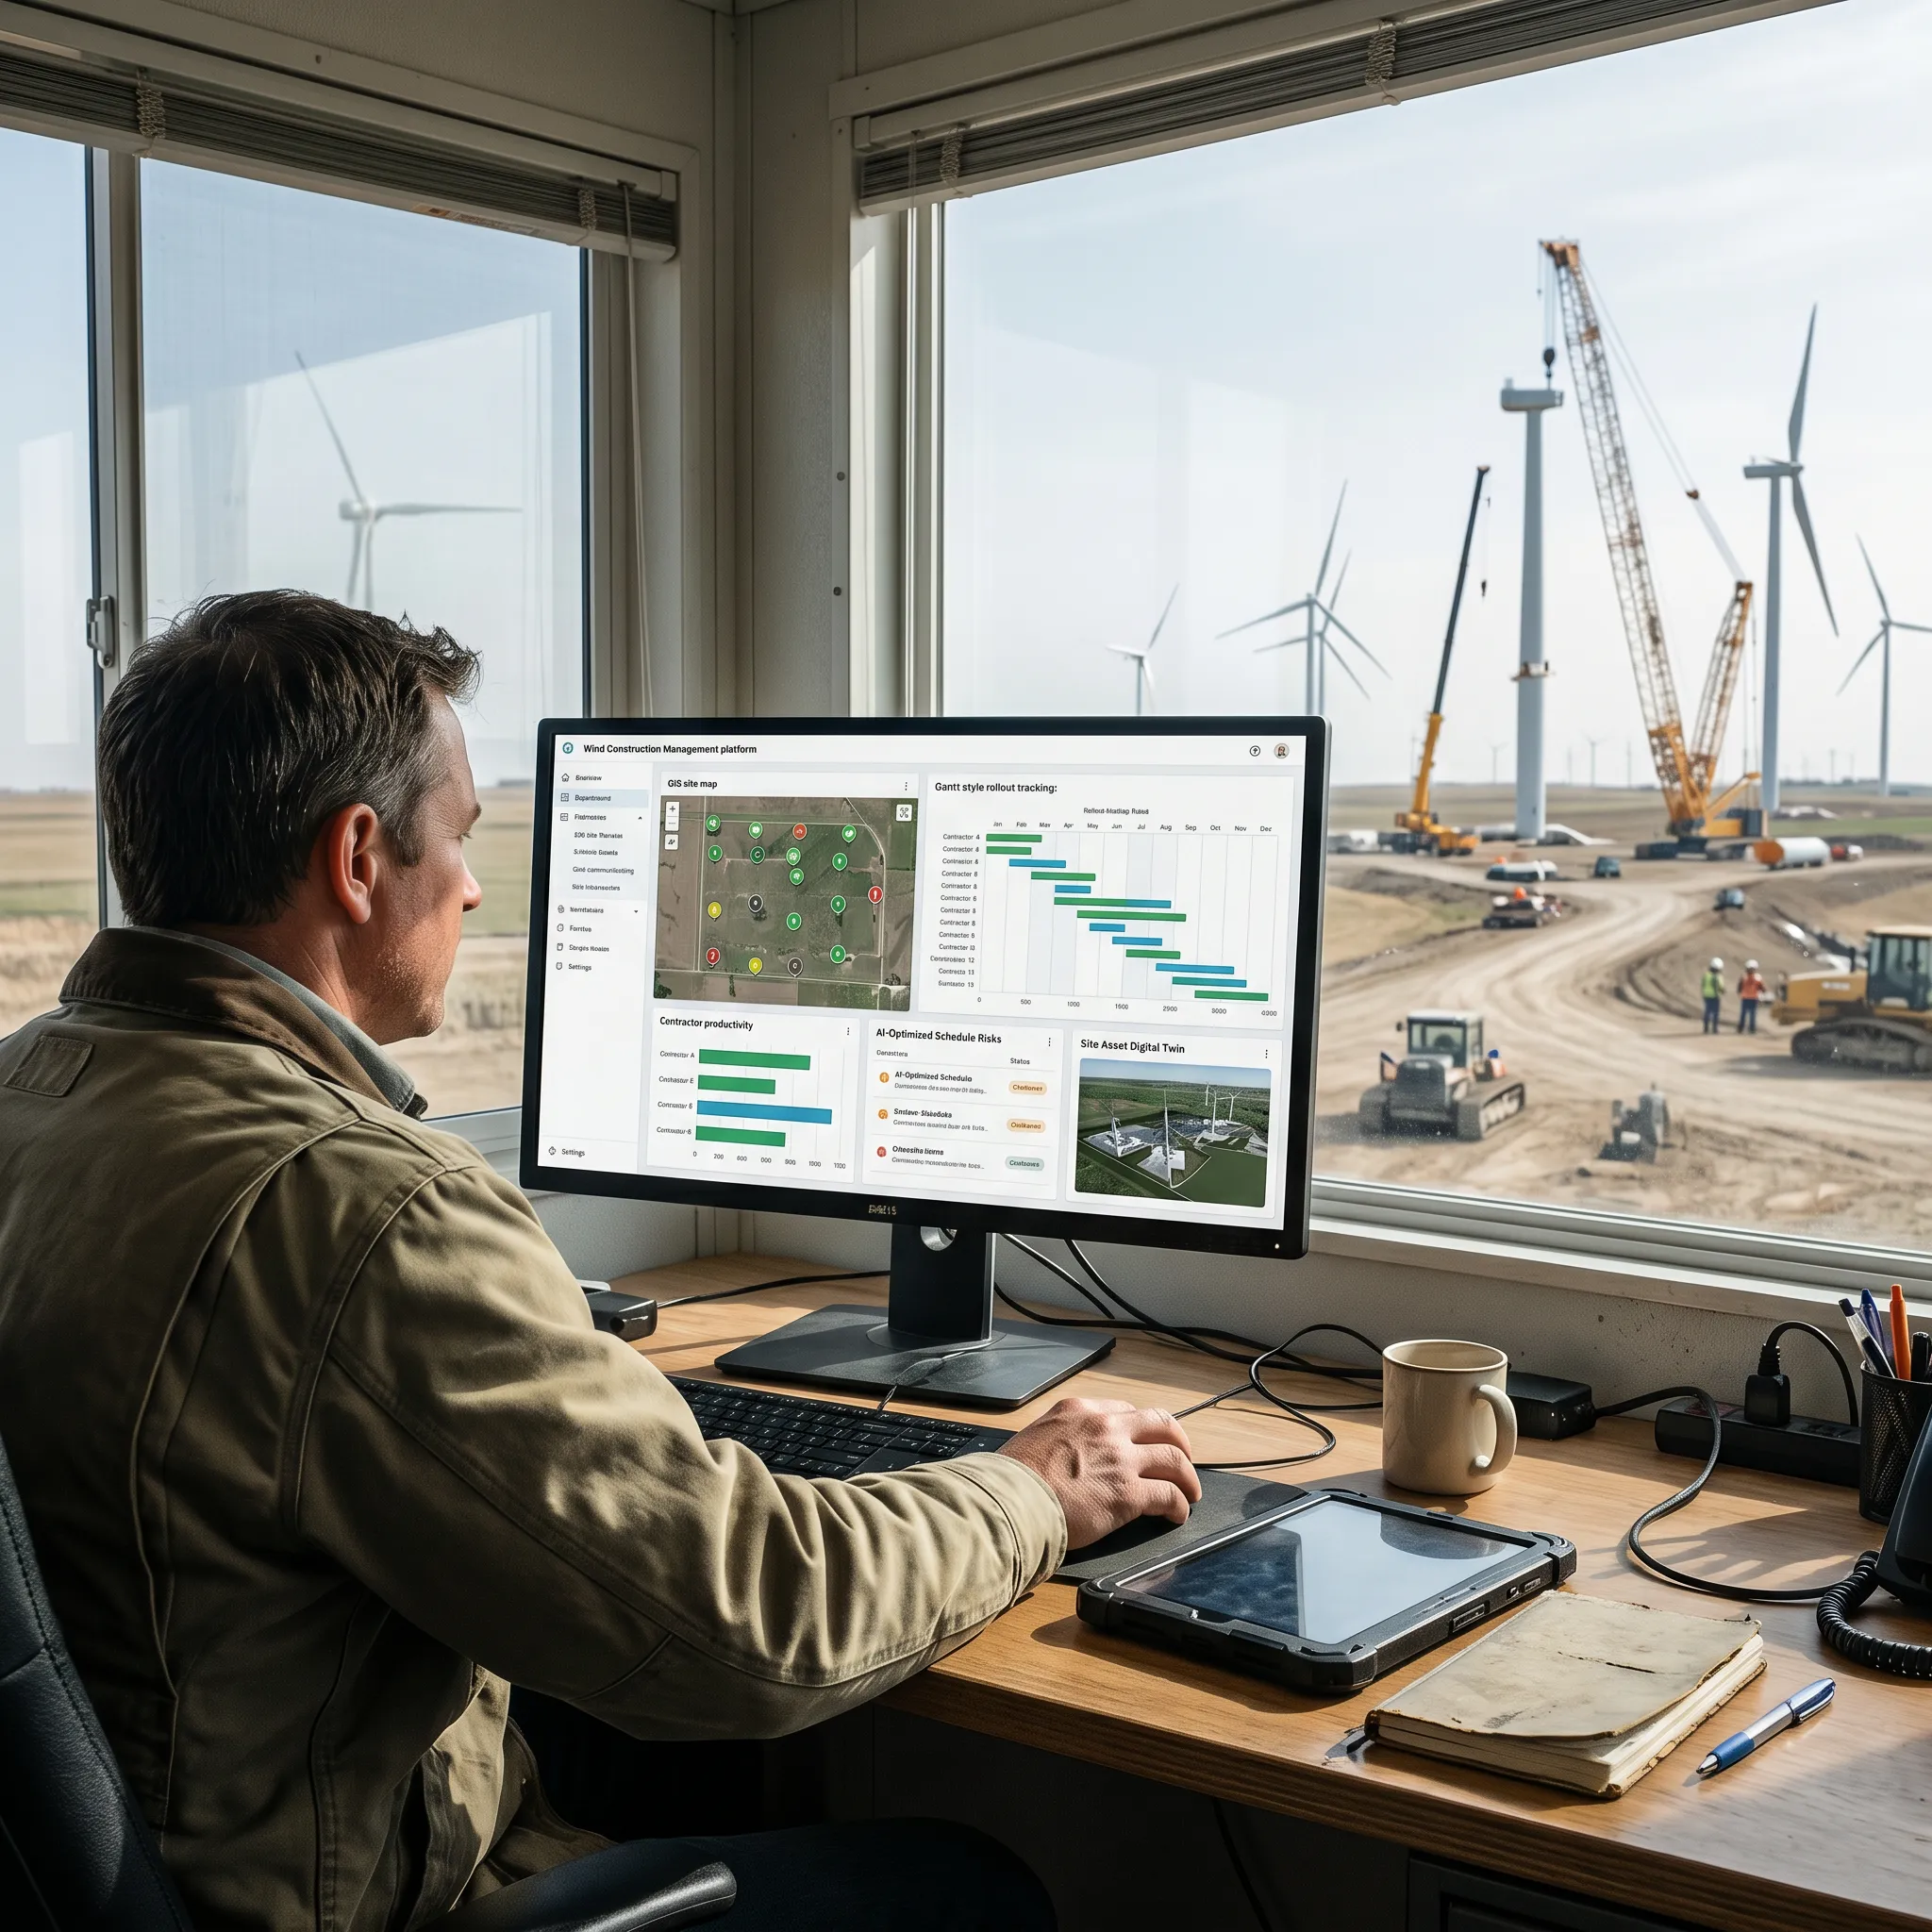
Field-Ready for Crews. Decision-Ready for Wind Leaders.

Field teams can navigate turbine locations, update foundation, road, lifting, and electrical work progress, capture geo-tagged photos, complete QA/QC forms, and submit daily field updates directly from site - even across remote wind farms. Managers get live site maps, automated S-curves, contractor performance views, and schedule risk insights. With NaaviX AI, teams can ask natural-language questions and move from field updates to faster wind project decisions.

NaaviX Prompt Examples

Which turbine pads are behind schedule this week?

Are access roads ready for blade and nacelle deliveries?

Which foundation or lift activities could impact the COD milestone?

Built for the field, trusted by enterprises

Built for the field, trusted by enterprises

Built for the field, trusted by enterprises

Frequently Asked Questions

Does SenseHawk support turbine blade inspections?

Can we manage the construction of wind access roads and foundations?

How does the platform handle the high-altitude data of wind assets?

Engineer in safety gear standing beside solar panels at sunset on a solar farm site.

Build and Manage Wind Farm Construction with One Source of Truth.

Whether you're tracking foundation progress, managing large-scale turbine installations, or overseeing multi-contractor workflows, TaskMapper helps your teams work from the same live reality - from breaking ground to commercial operation date (COD).