


Trusted by Teams Building and Operating Solar at Scale
Sites Digitized
One platform for the entire solar lifecycle
Your solar data lives in spreadsheets, ERPs, and WhatsApp threads. These data silos prevent easy transfer of information between teams during Development, Construction and Handover to Operations.
SenseHawk brings it all into one map-based platform — connecting scattered teams, fragmented workflows, and lifecycle gaps into a single source of truth.
The Solar Value Chain
Empowering every role in the solar value chain.
From pre-construction to repowering, we provide a unified geospatial system of record - connecting scattered teams and siloed data across your entire portfolio.


Platform
One Platform Across the Solar Lifecycle
SenseHawk keeps project data continuous across every phase of the asset lifecycle - so handovers are cleaner, decisions are faster, and every team works from the same source of truth.


Digital Twin
More Than a Map. A Living Model of Your Solar Asset.
SenseHawk combines a Map Twin, Equipment Twin, and Process Twin in one relational system. That means every module, string, inverter, transformer, and substation can be connected to documents, inspections, test results, tasks, and performance history.
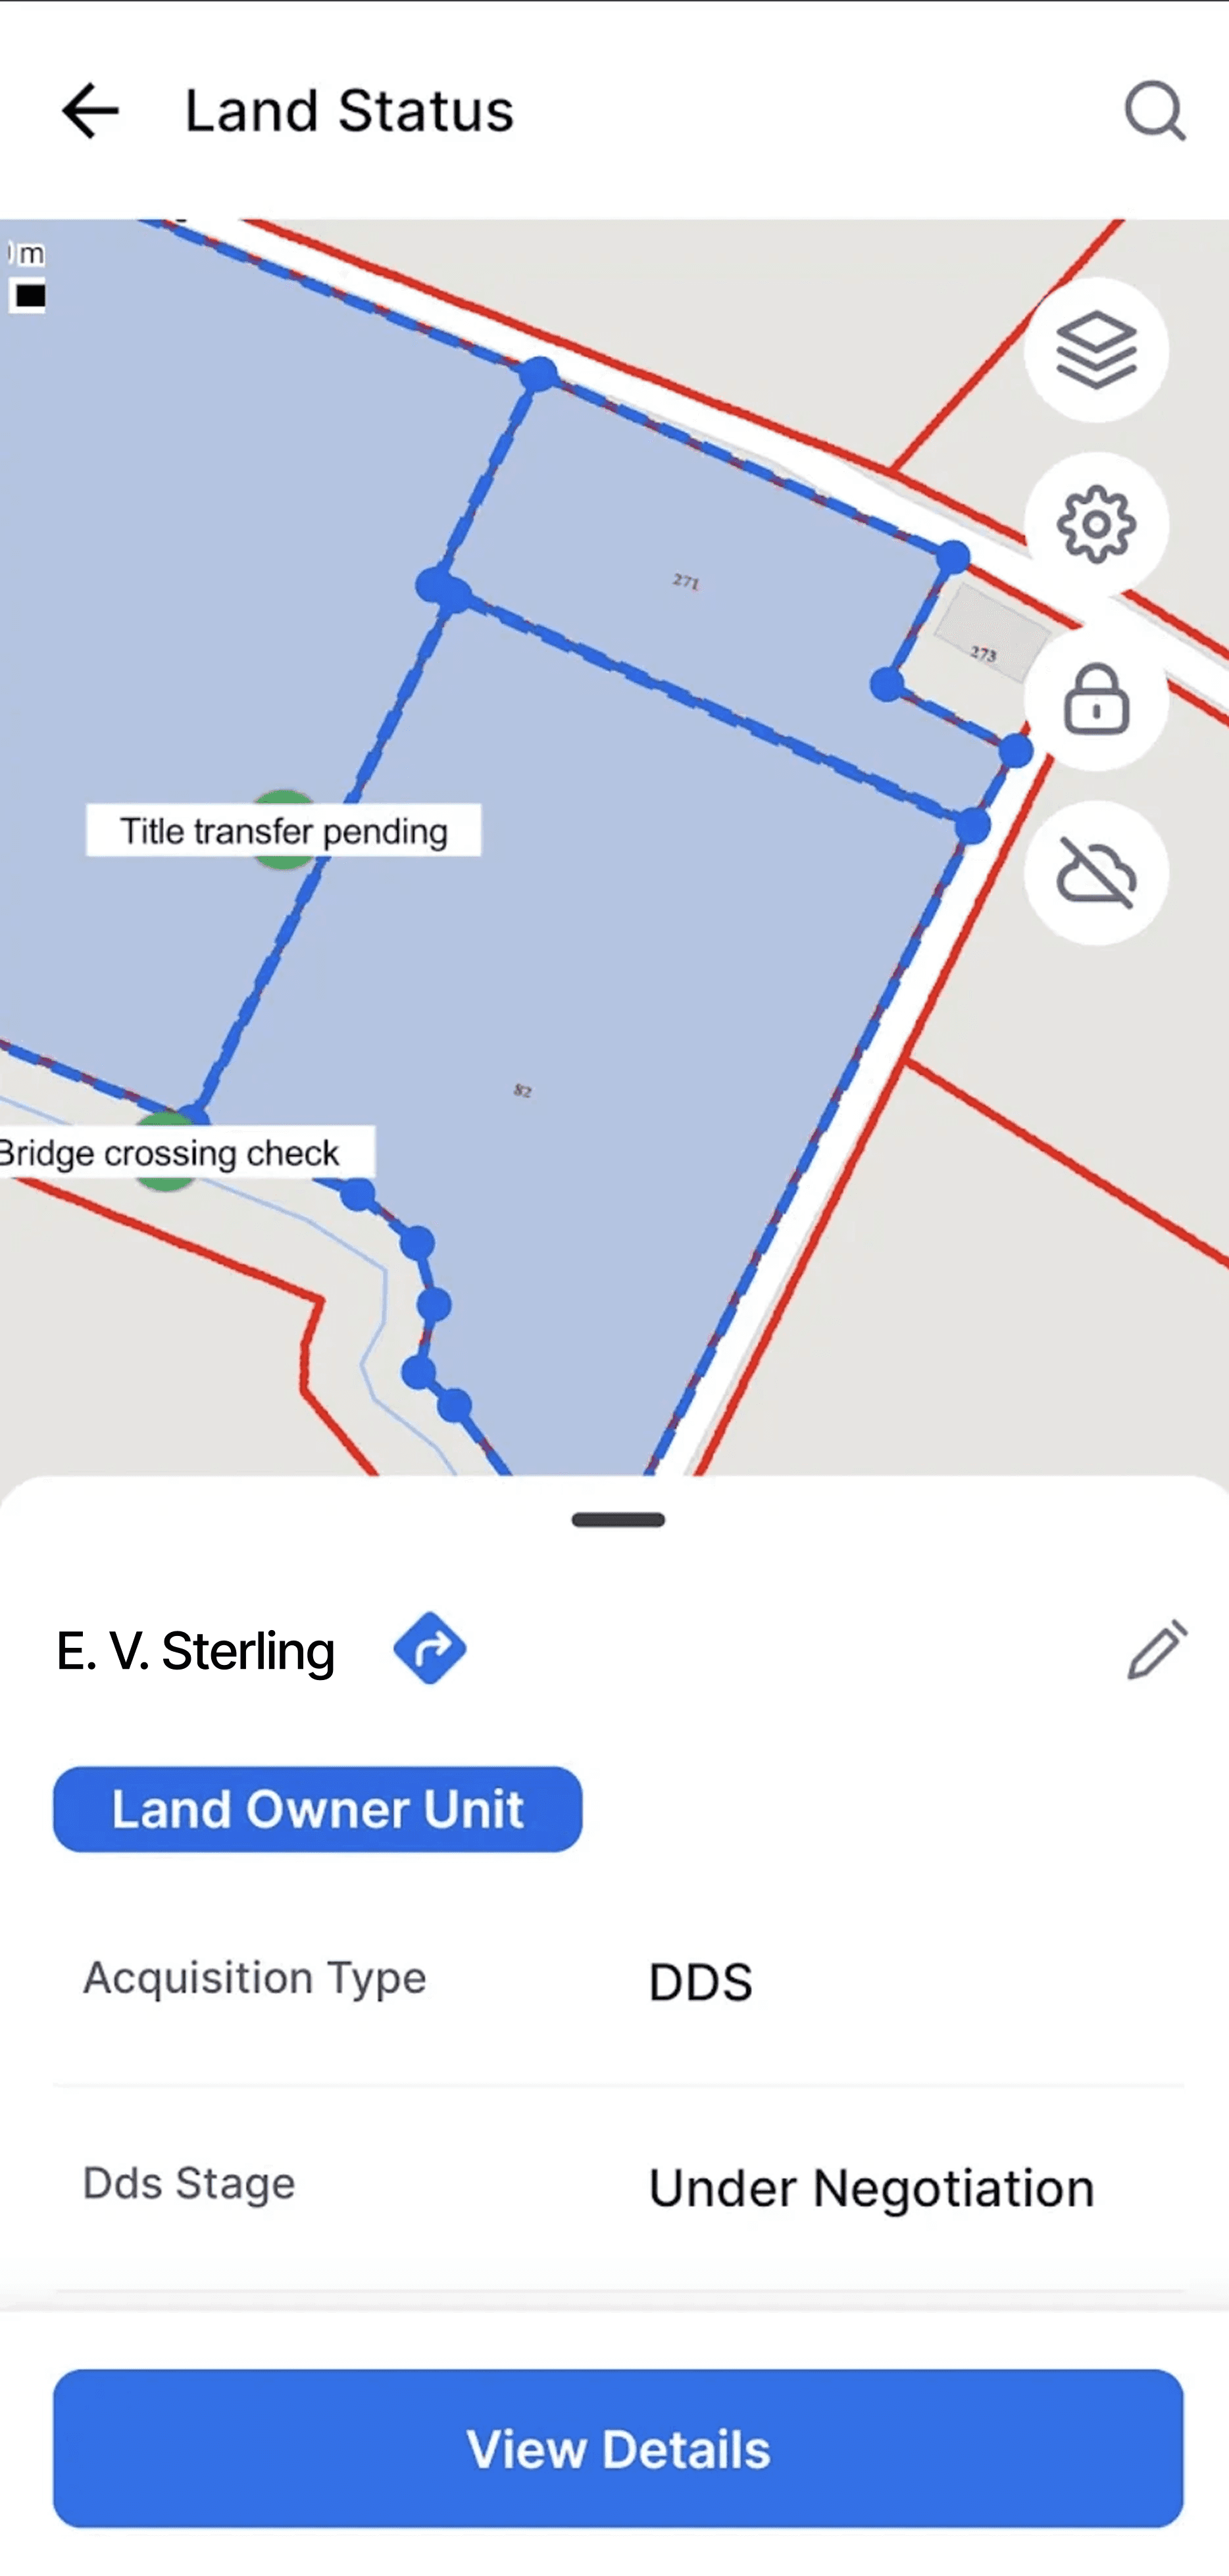
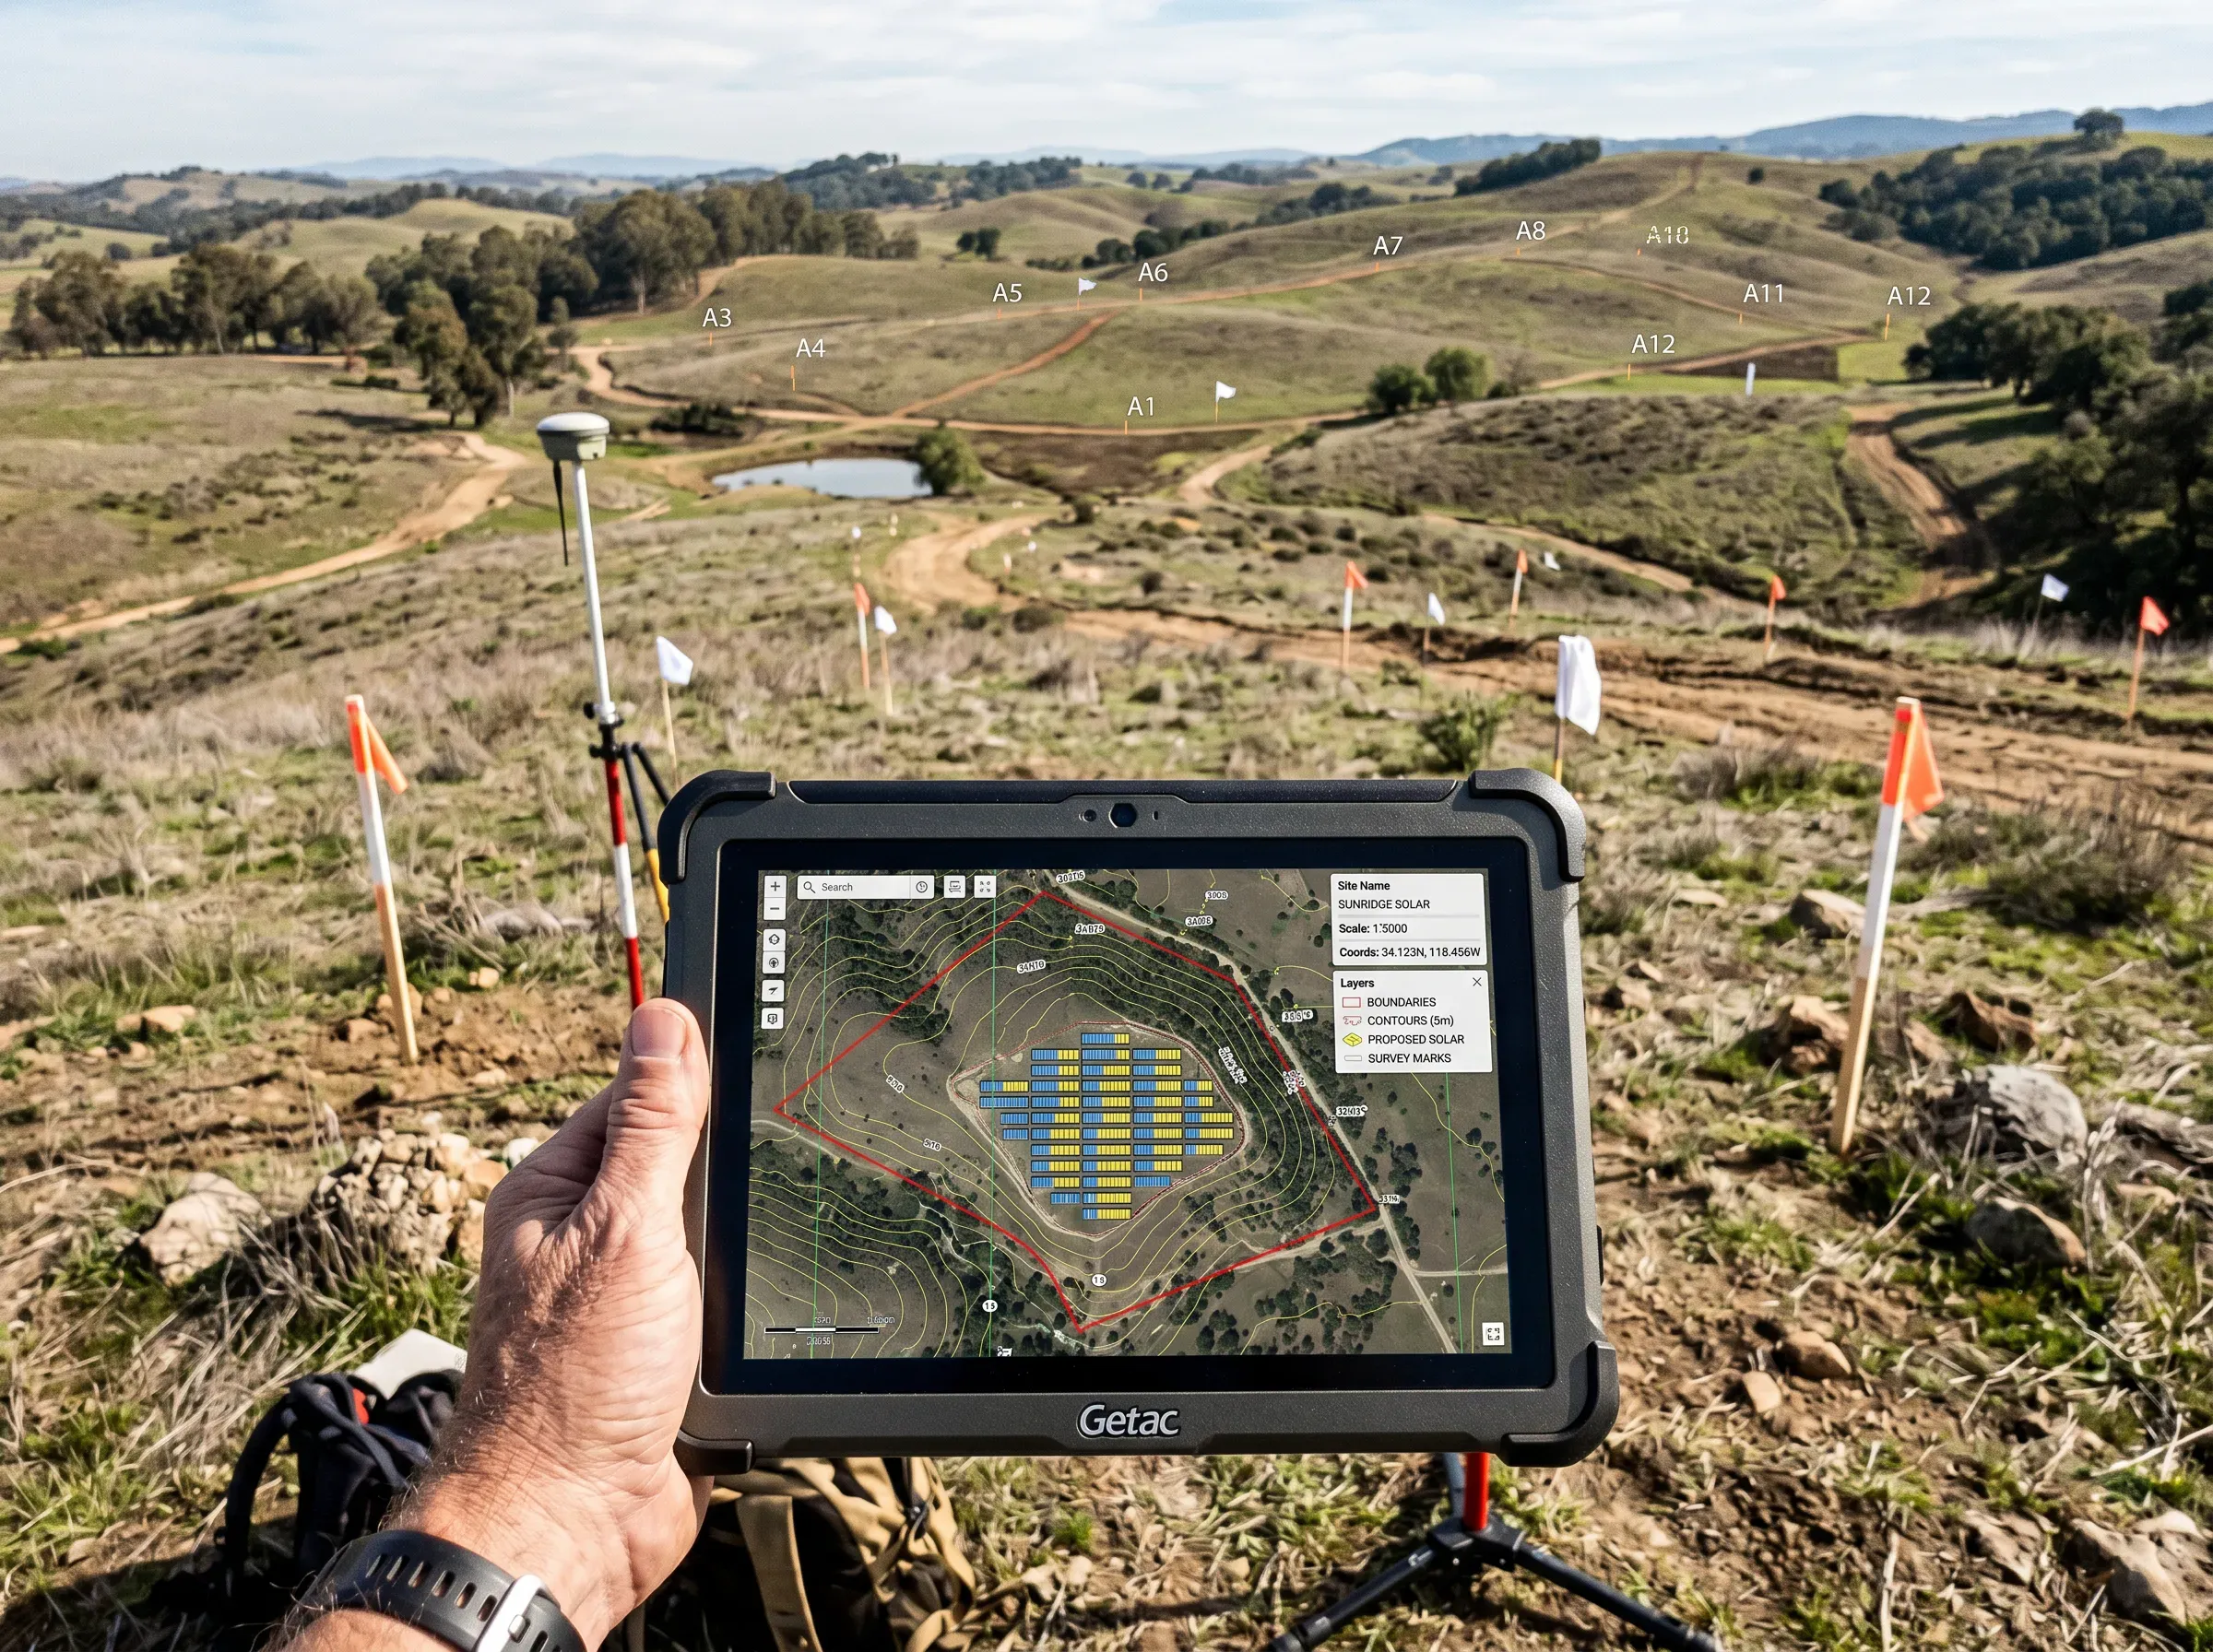
Map Twin
Bring together orthomosaics, GIS layers, terrain data, CAD, and design-vs-as-built context in one geospatial view.
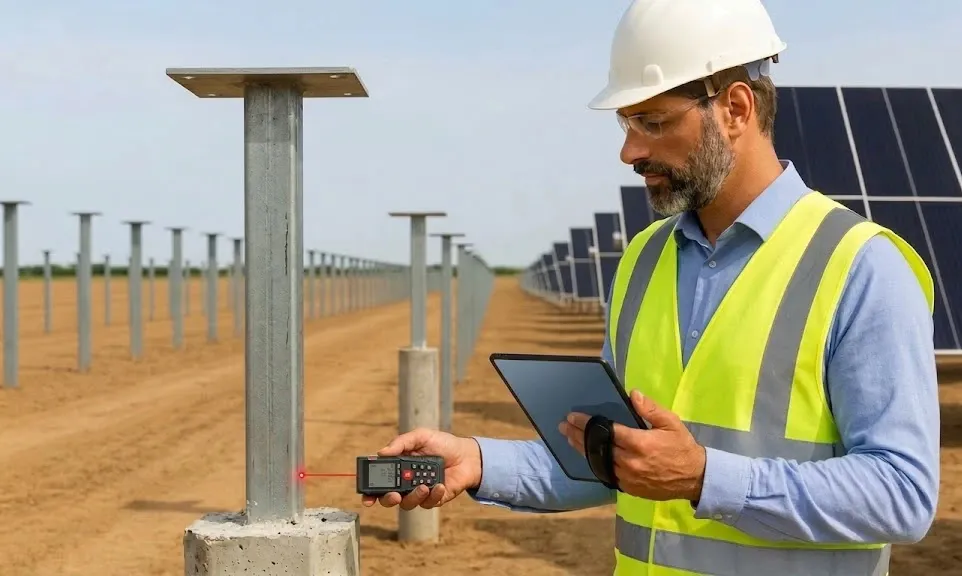
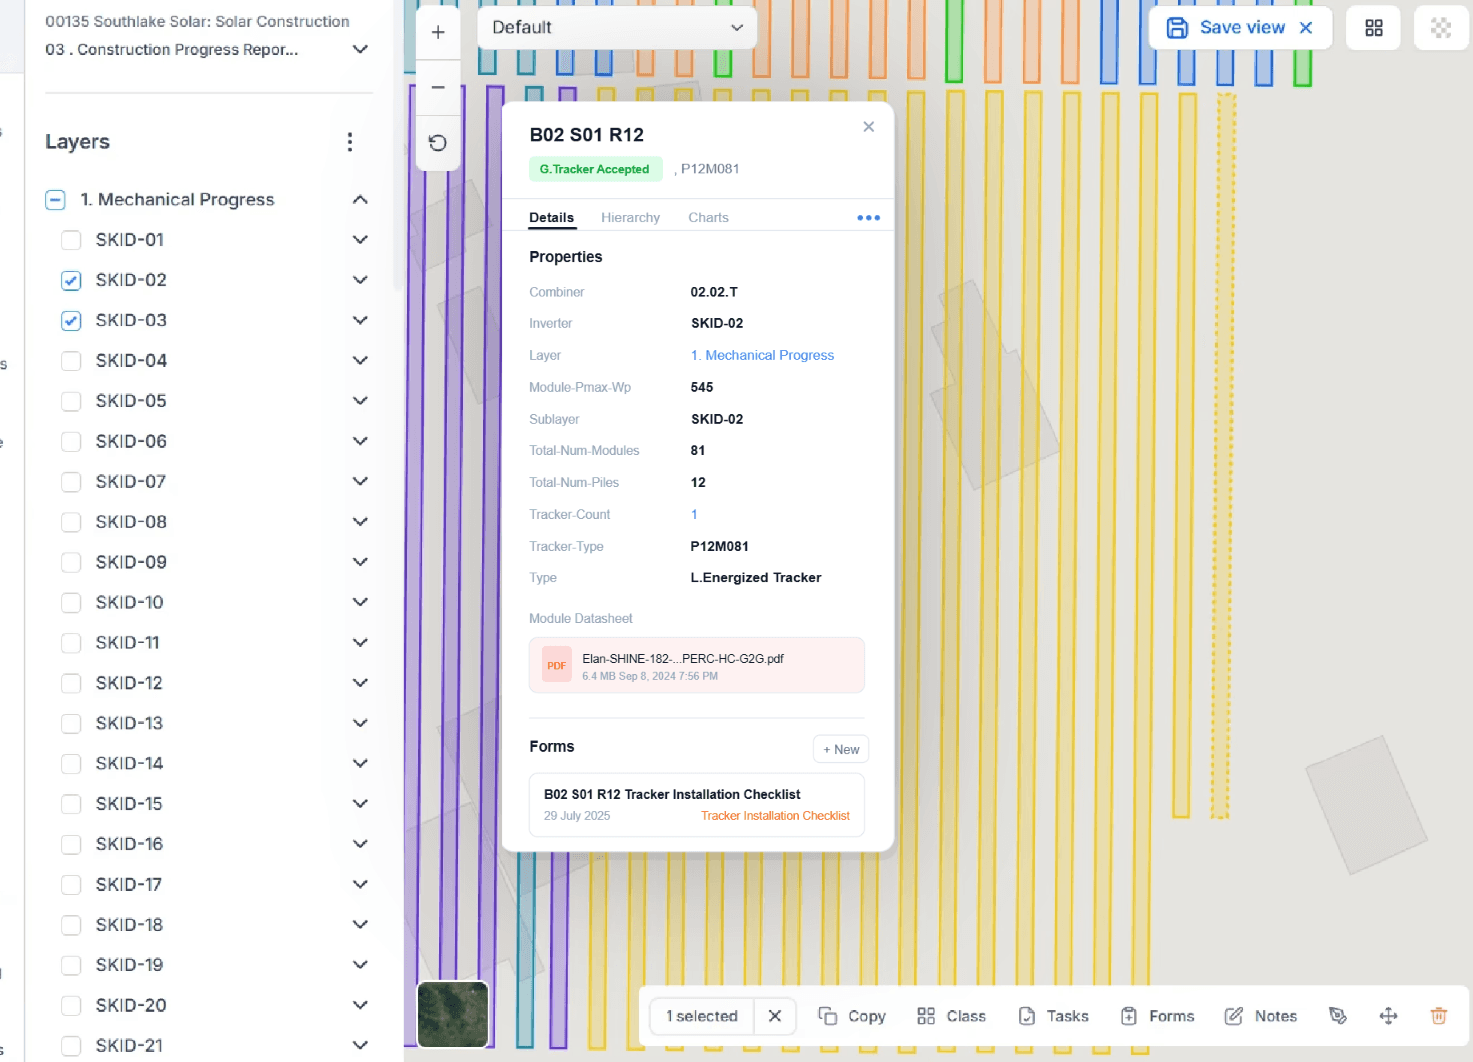
Equipment Twin
Track serialized components with datasheets, warranties, IV curves, EL imagery, commissioning records, and maintenance history tied to each asset.
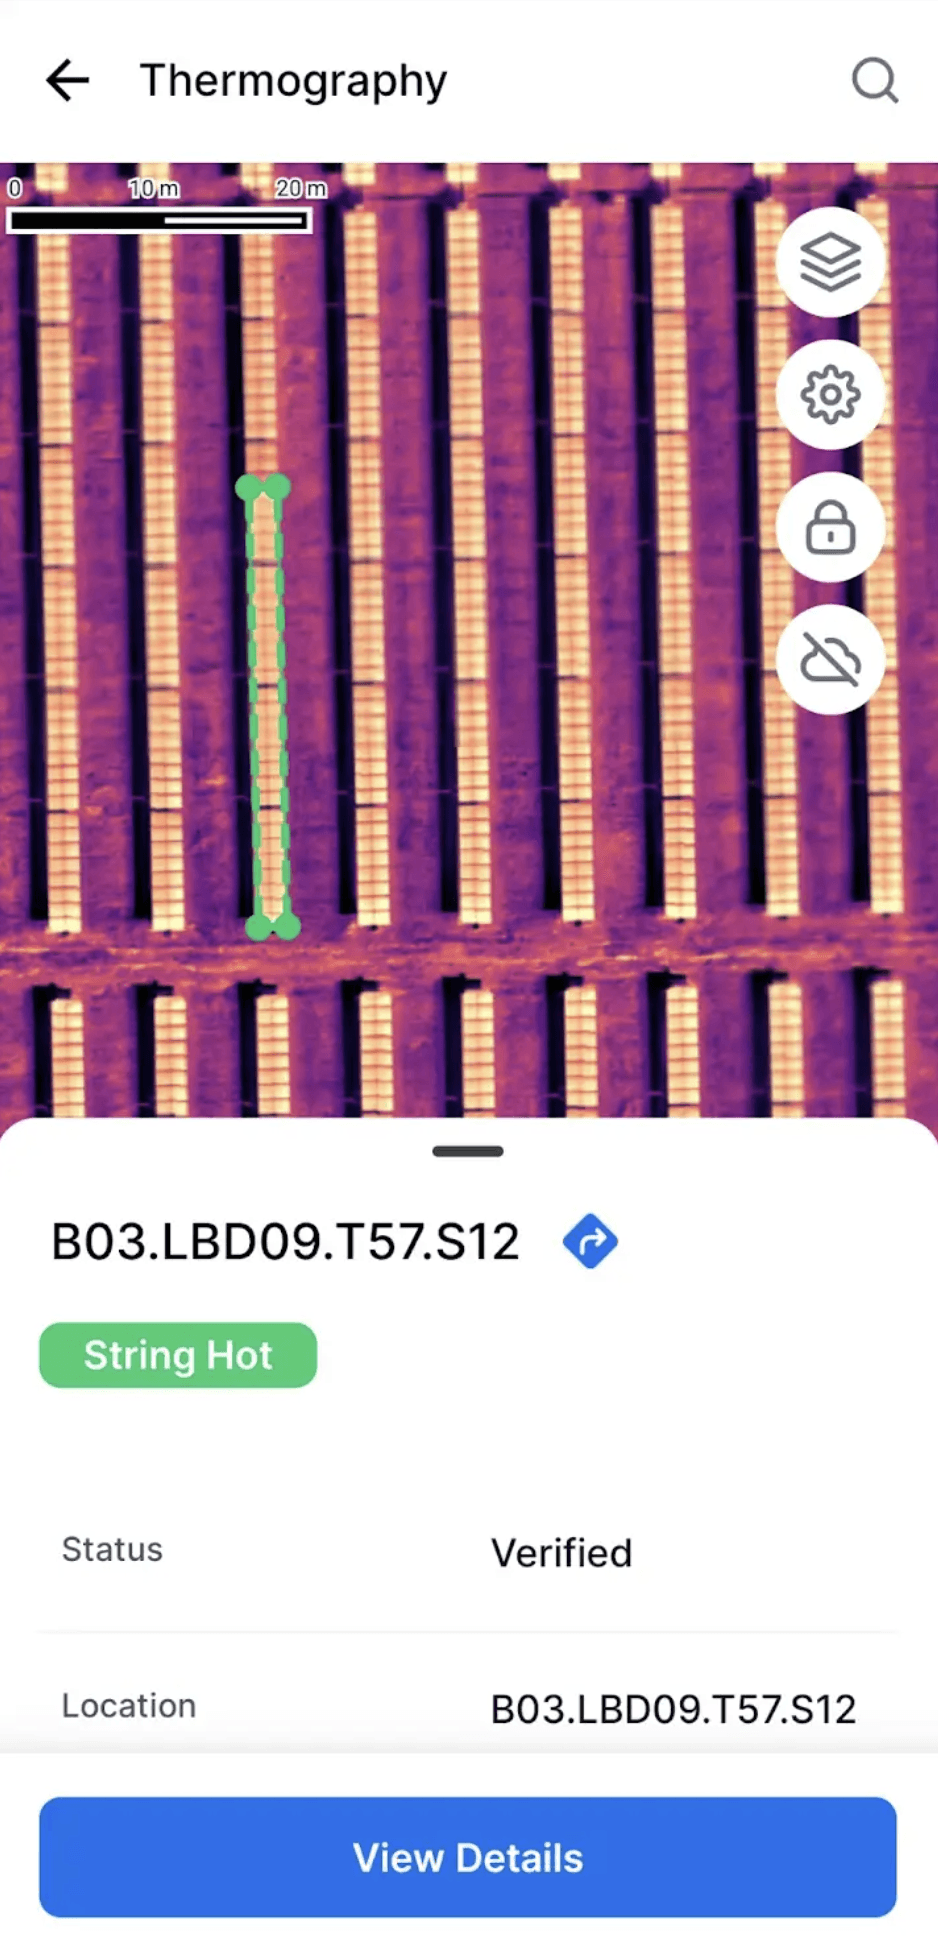
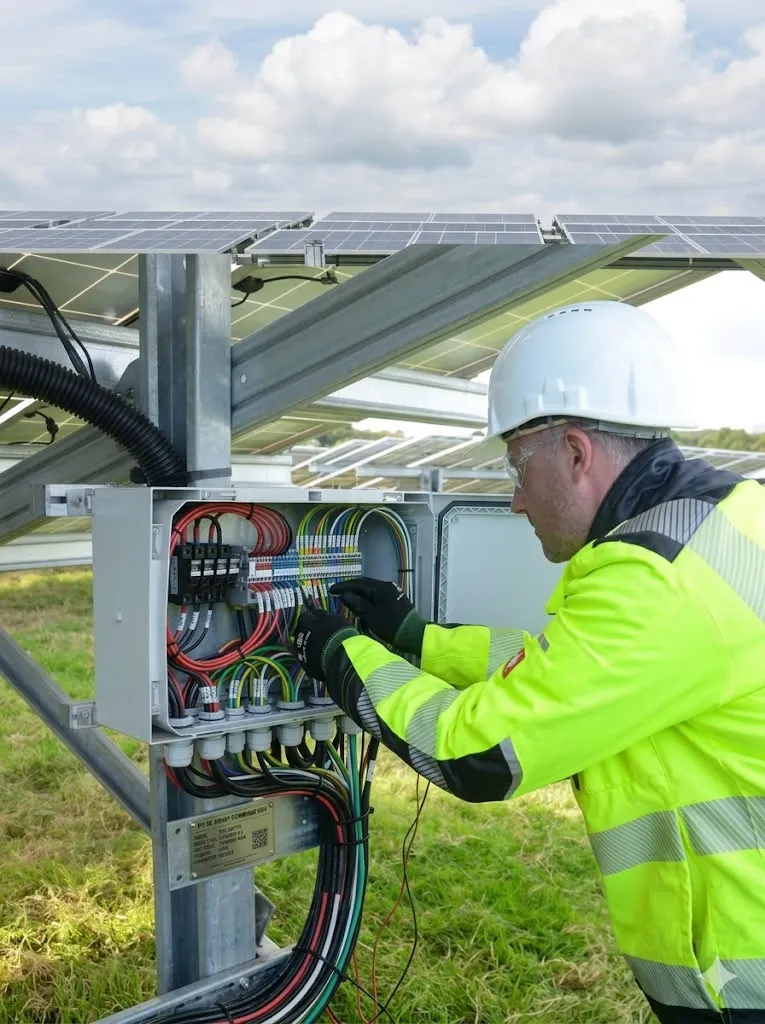
Process Twin
Digitize inspections, NCRs, approvals, punch lists, and workflows - then connect them directly to the exact asset on site.

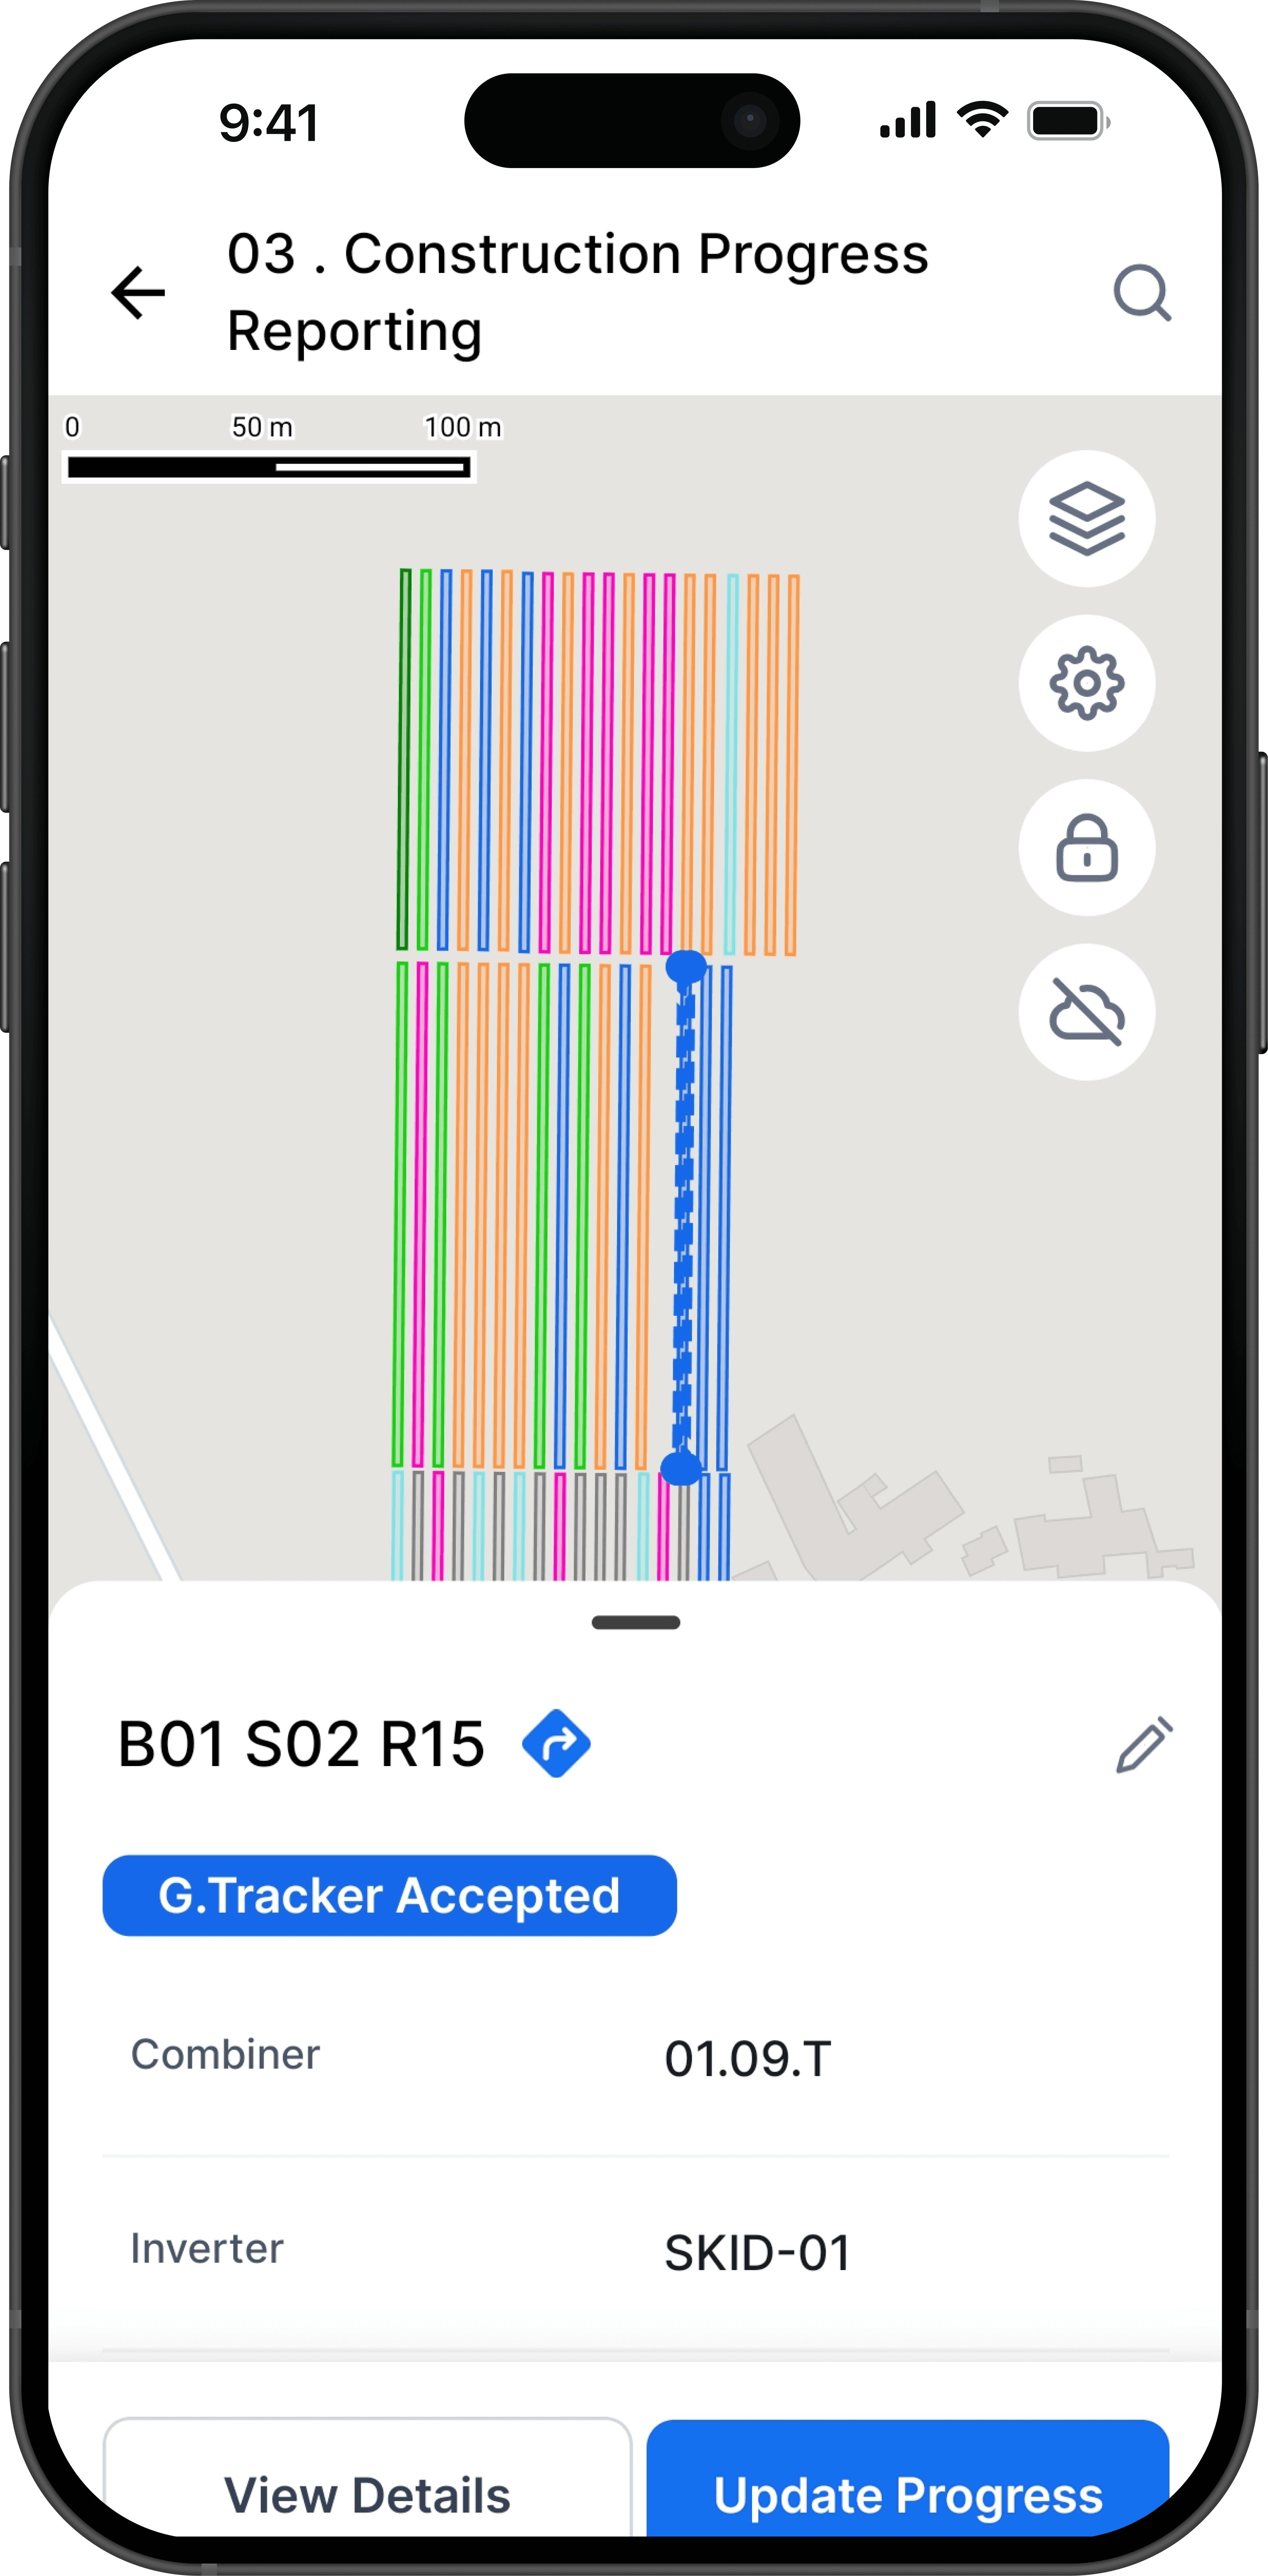
Workflows
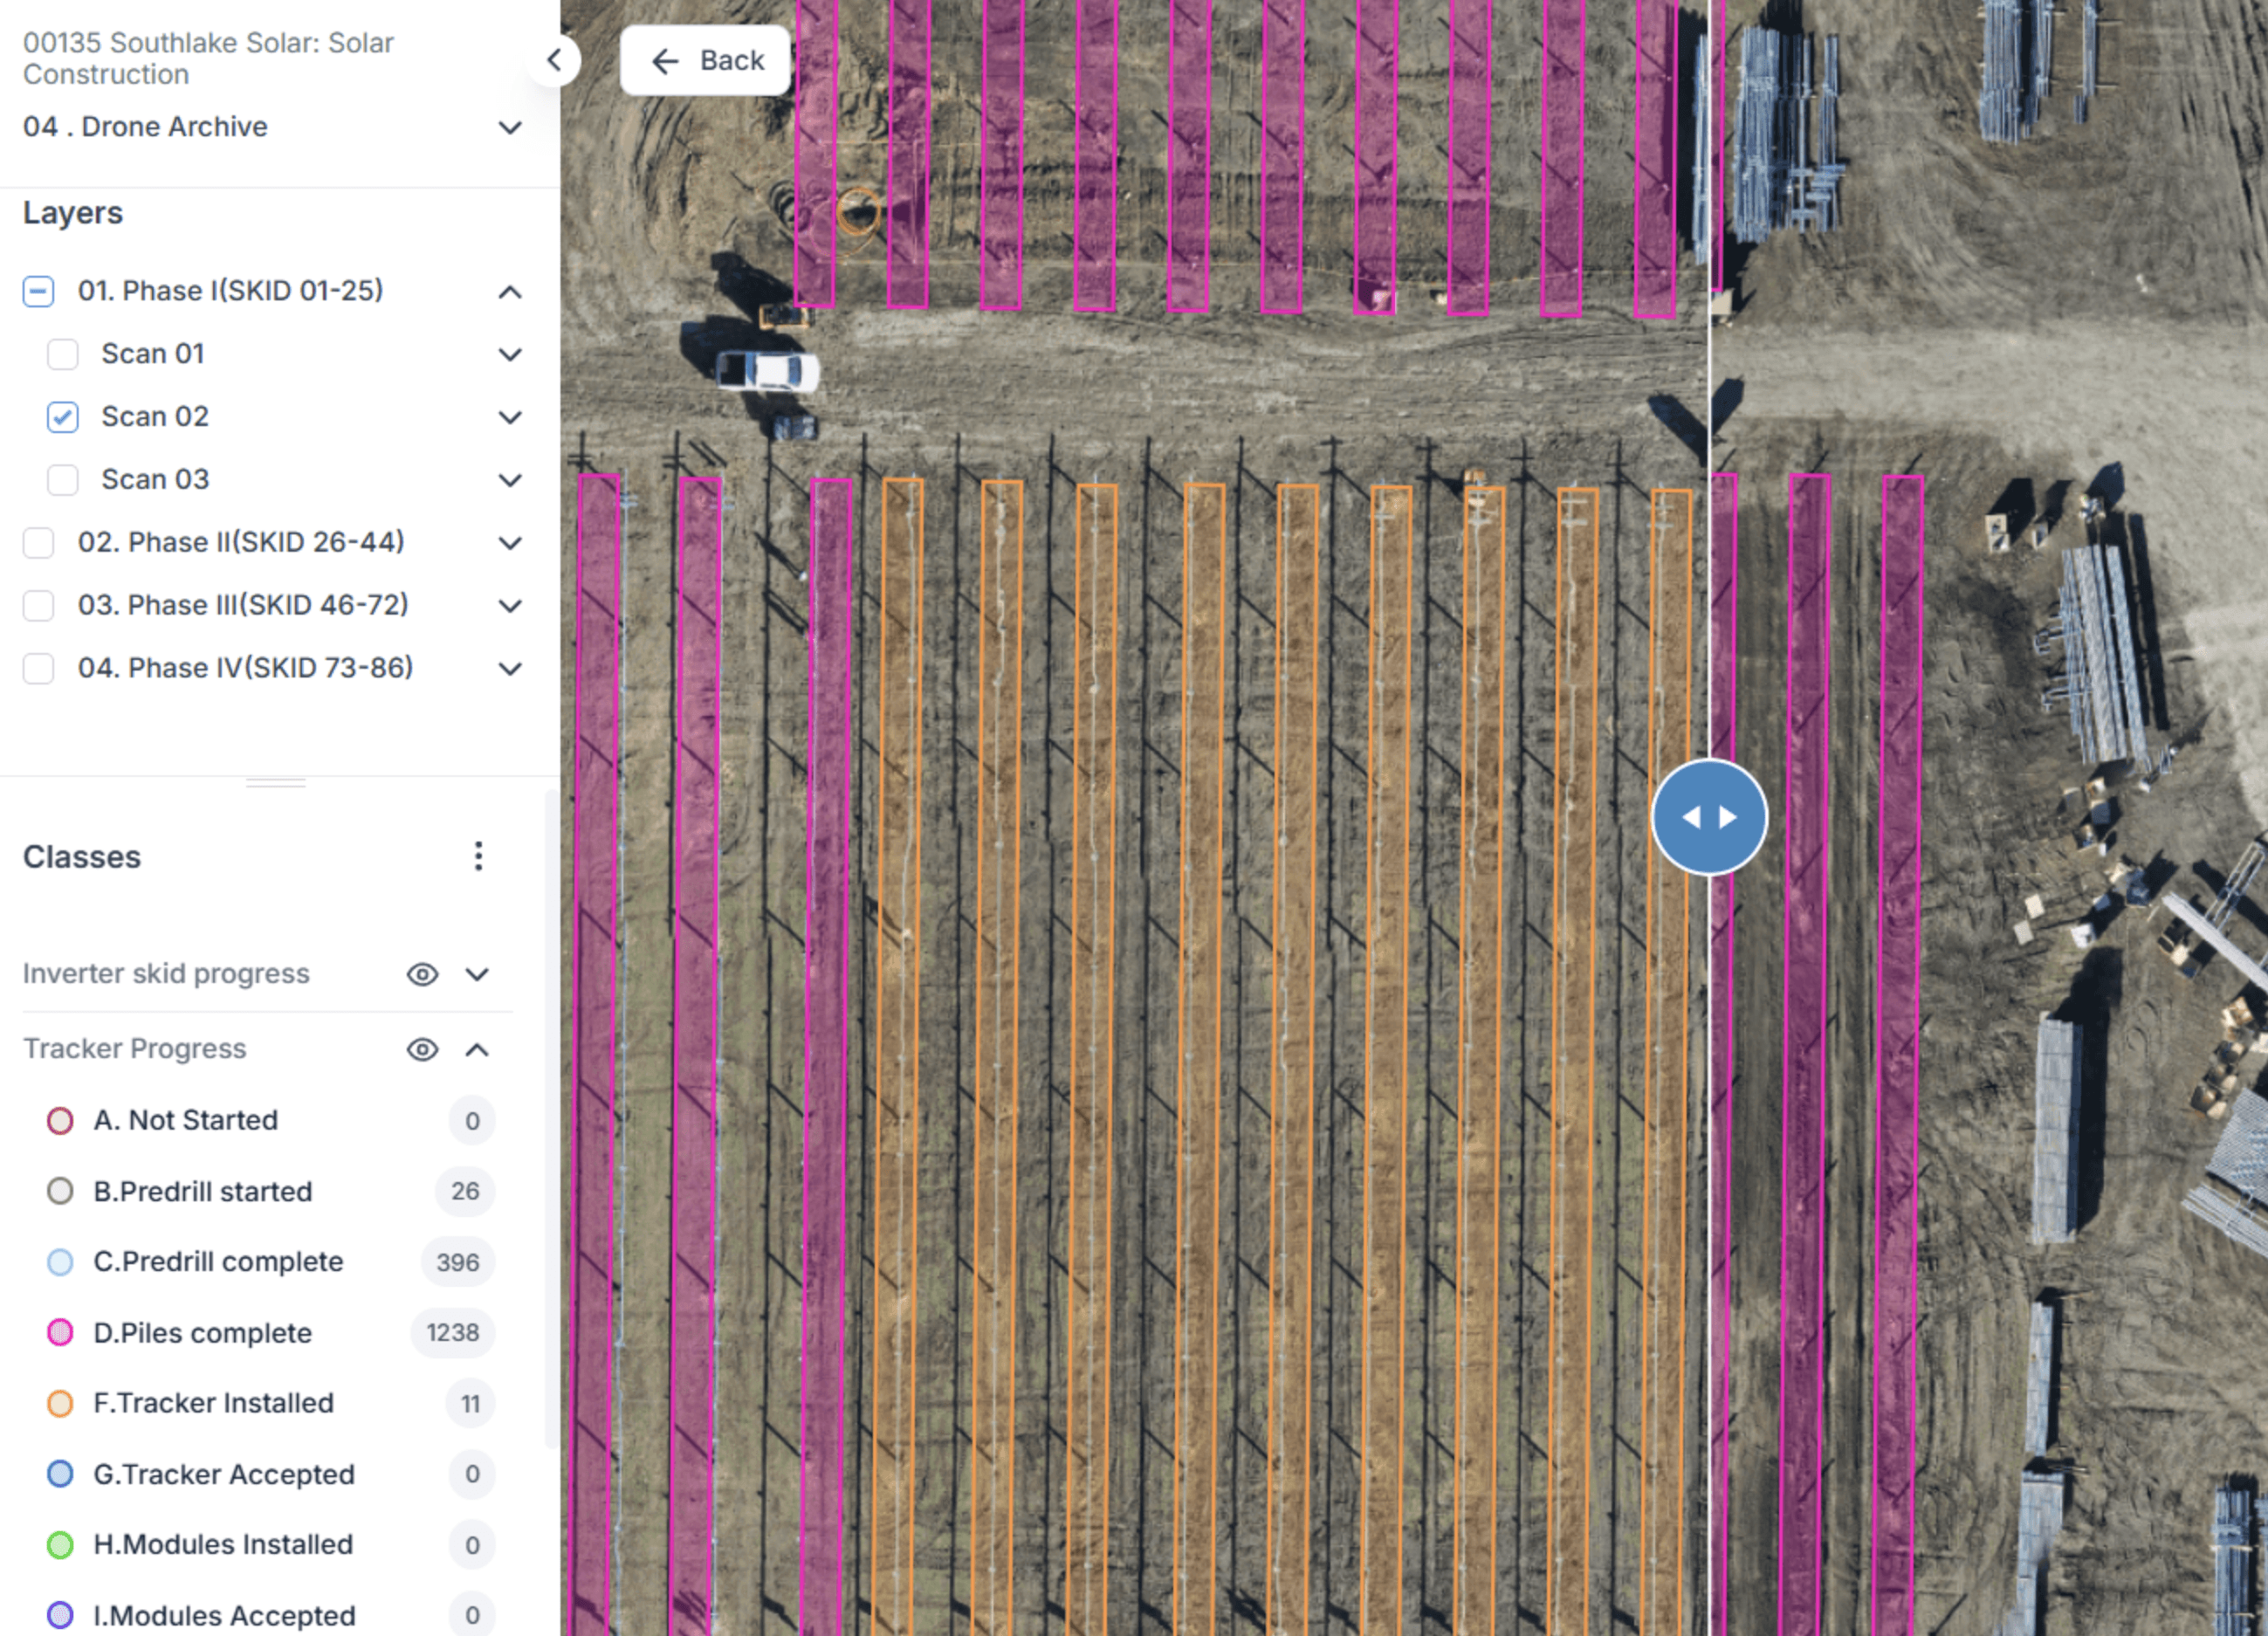
Built for the Work Solar Teams Actually Do
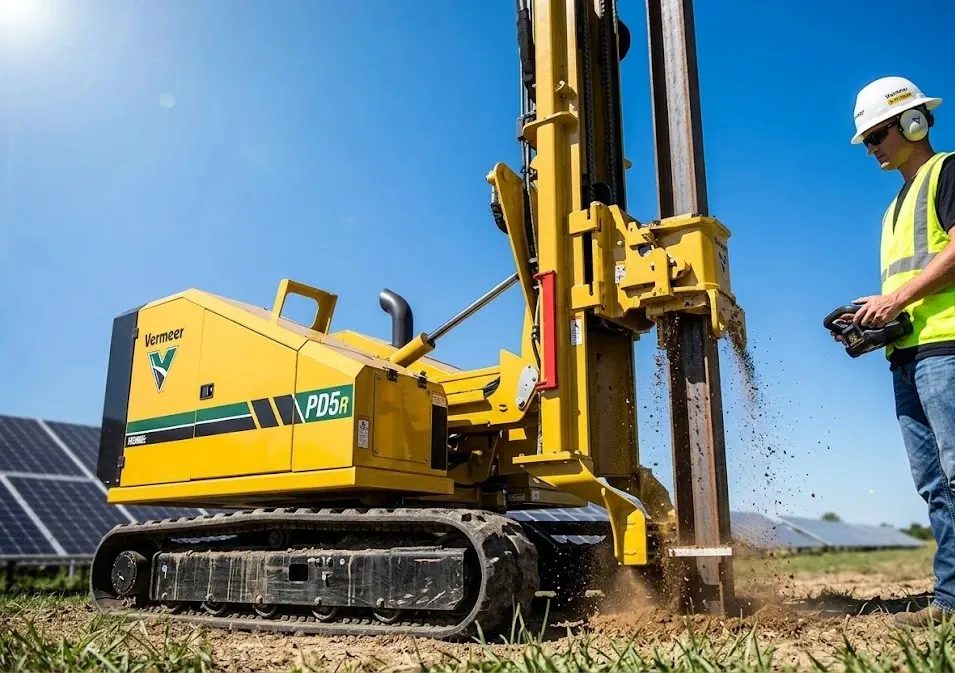
SenseHawk is designed around real solar workflows - from layout validation and progress tracking to punch lists, thermal inspections, and digital handover.

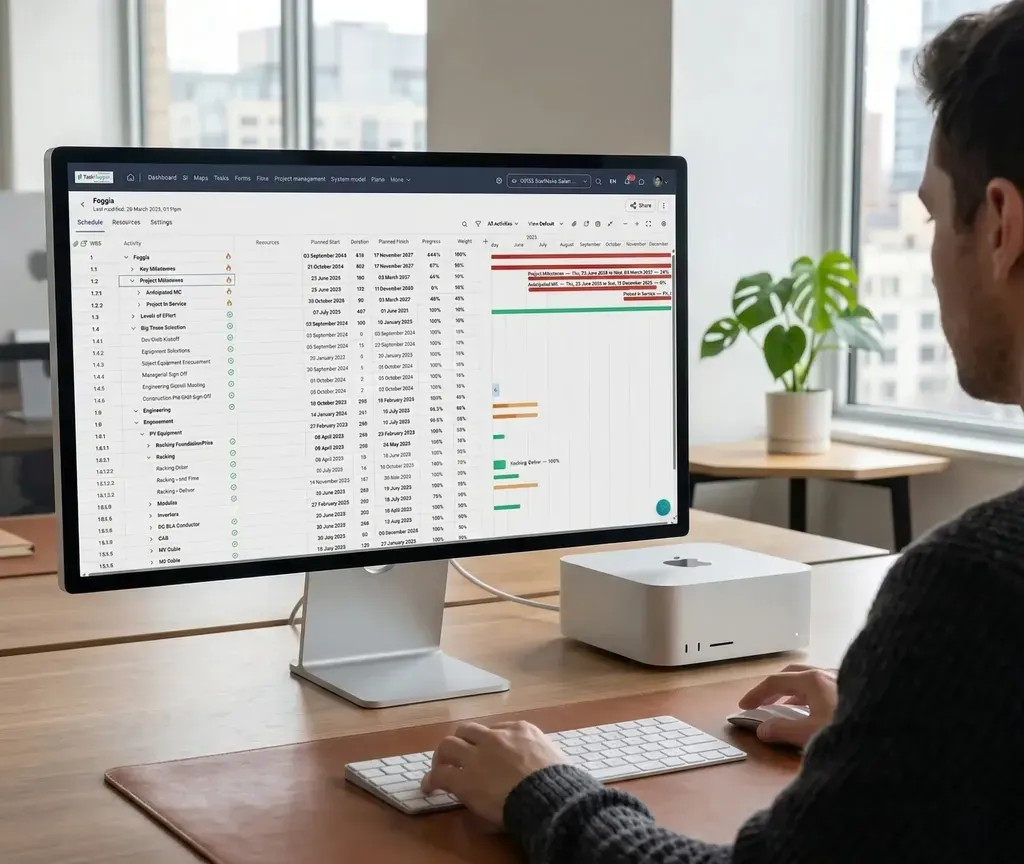
Mobile + AI
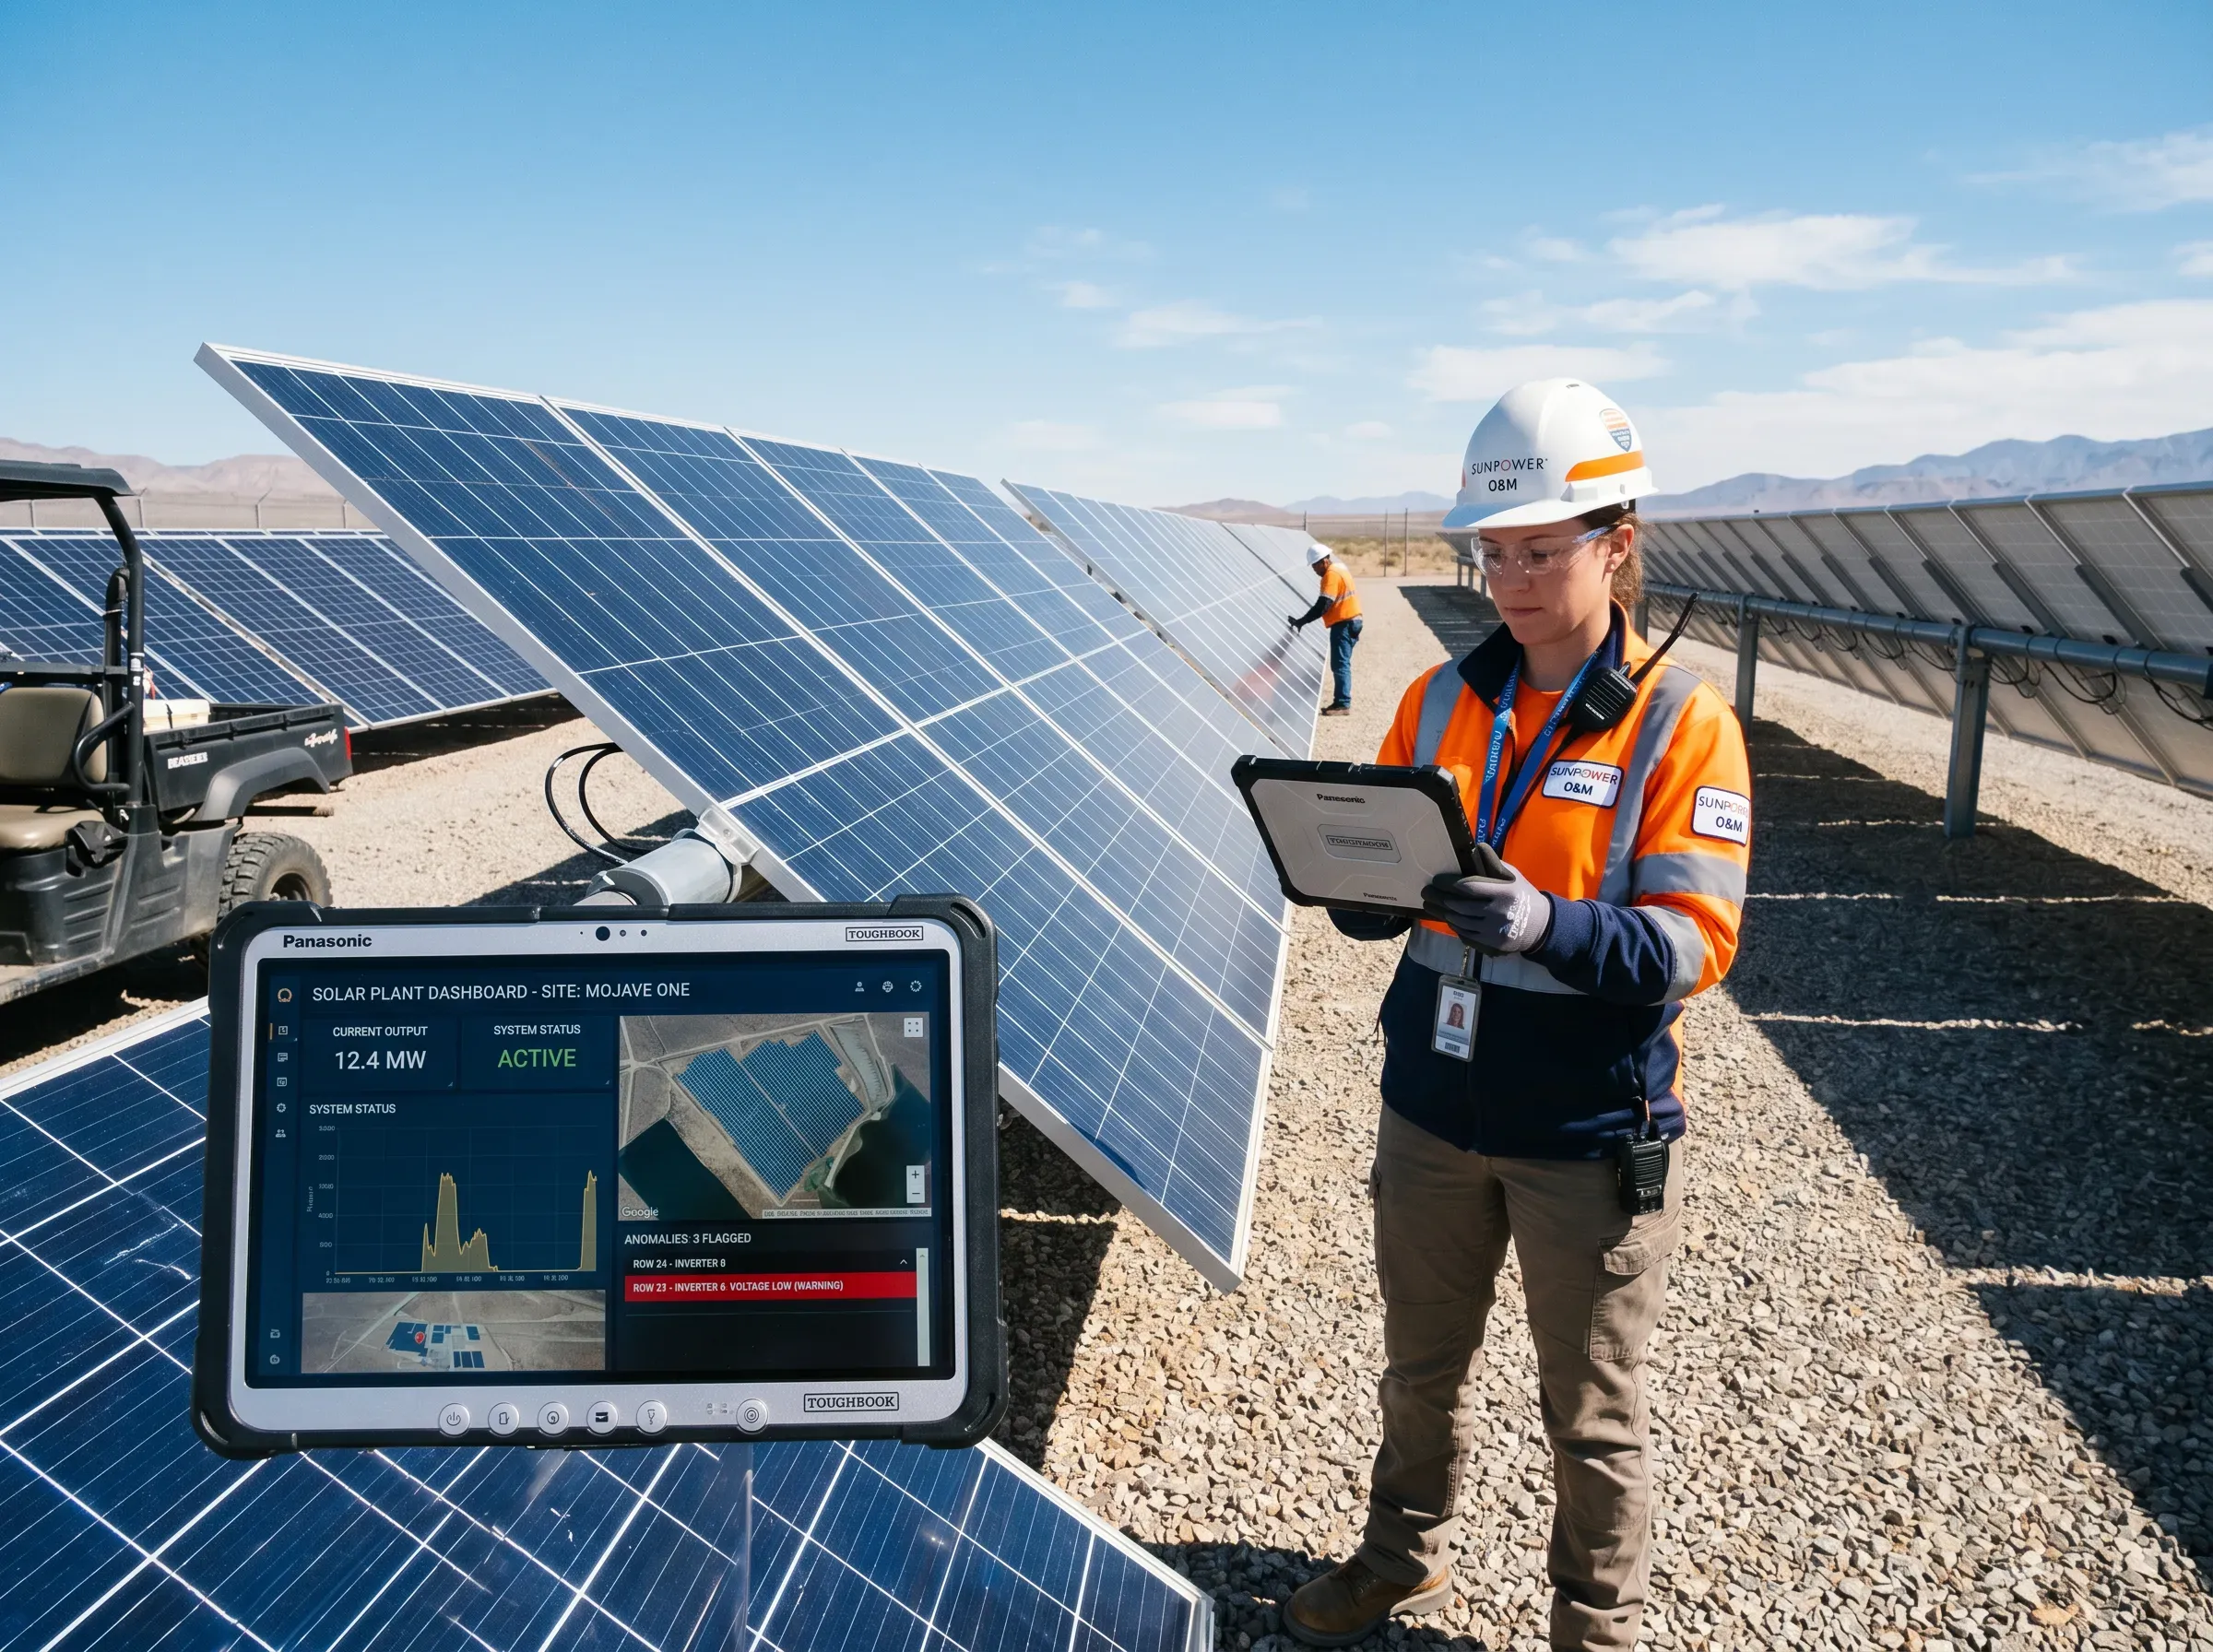
Field-Ready for Crews. Decision-Ready for Leaders.
Site teams can capture progress, inspections, photos, and forms from the field - even in low-connectivity environments. Managers get live dashboards, map-based drill-downs, and a clearer view of schedule, quality, and risk. With NaaviX AI, teams can ask natural-language questions and move from dashboard to decision faster.
NaaviX prompt examples
What activities are slipping this week?
Which strings show repeat anomalies?
Where are the biggest quality bottlenecks by contractor?

Why SenseHawk
Built for Solar. Not Adapted for It.
Generic construction tools were never designed for utility-scale solar. See how SenseHawk compares where it matters most.


Outcomes
Reduce delays with earlier visibility into progress, risks, and quality issues.
Cut rework through design validation, digital inspections, and traceable execution.
Accelerate commissioning with connected test data and faster punch list closure.
Improve warranty and compliance readiness with asset-level traceability.
Make better portfolio decisions with live dashboards, map-based context, and AI-driven insights.

Frequently Asked Questions
Can SenseHawk handle GW-scale portfolios?
Does the platform support hybrid Solar + BESS sites?
How accurate is the geospatial mapping?