
telecom
Trusted by Teams Building Telecom at Scale
projects digitized
One Platform for the Entire Telecom Lifecycle
Your telecom data lives in spreadsheets, ERPs, and WhatsApp threads. These data silos prevent easy transfer of information between teams during development, deployment, and handover to operations.
SenseHawk brings it all into one map-based platform — connecting scattered teams, fragmented workflows, and lifecycle gaps into a single source of truth.
The Telecom Value Chain
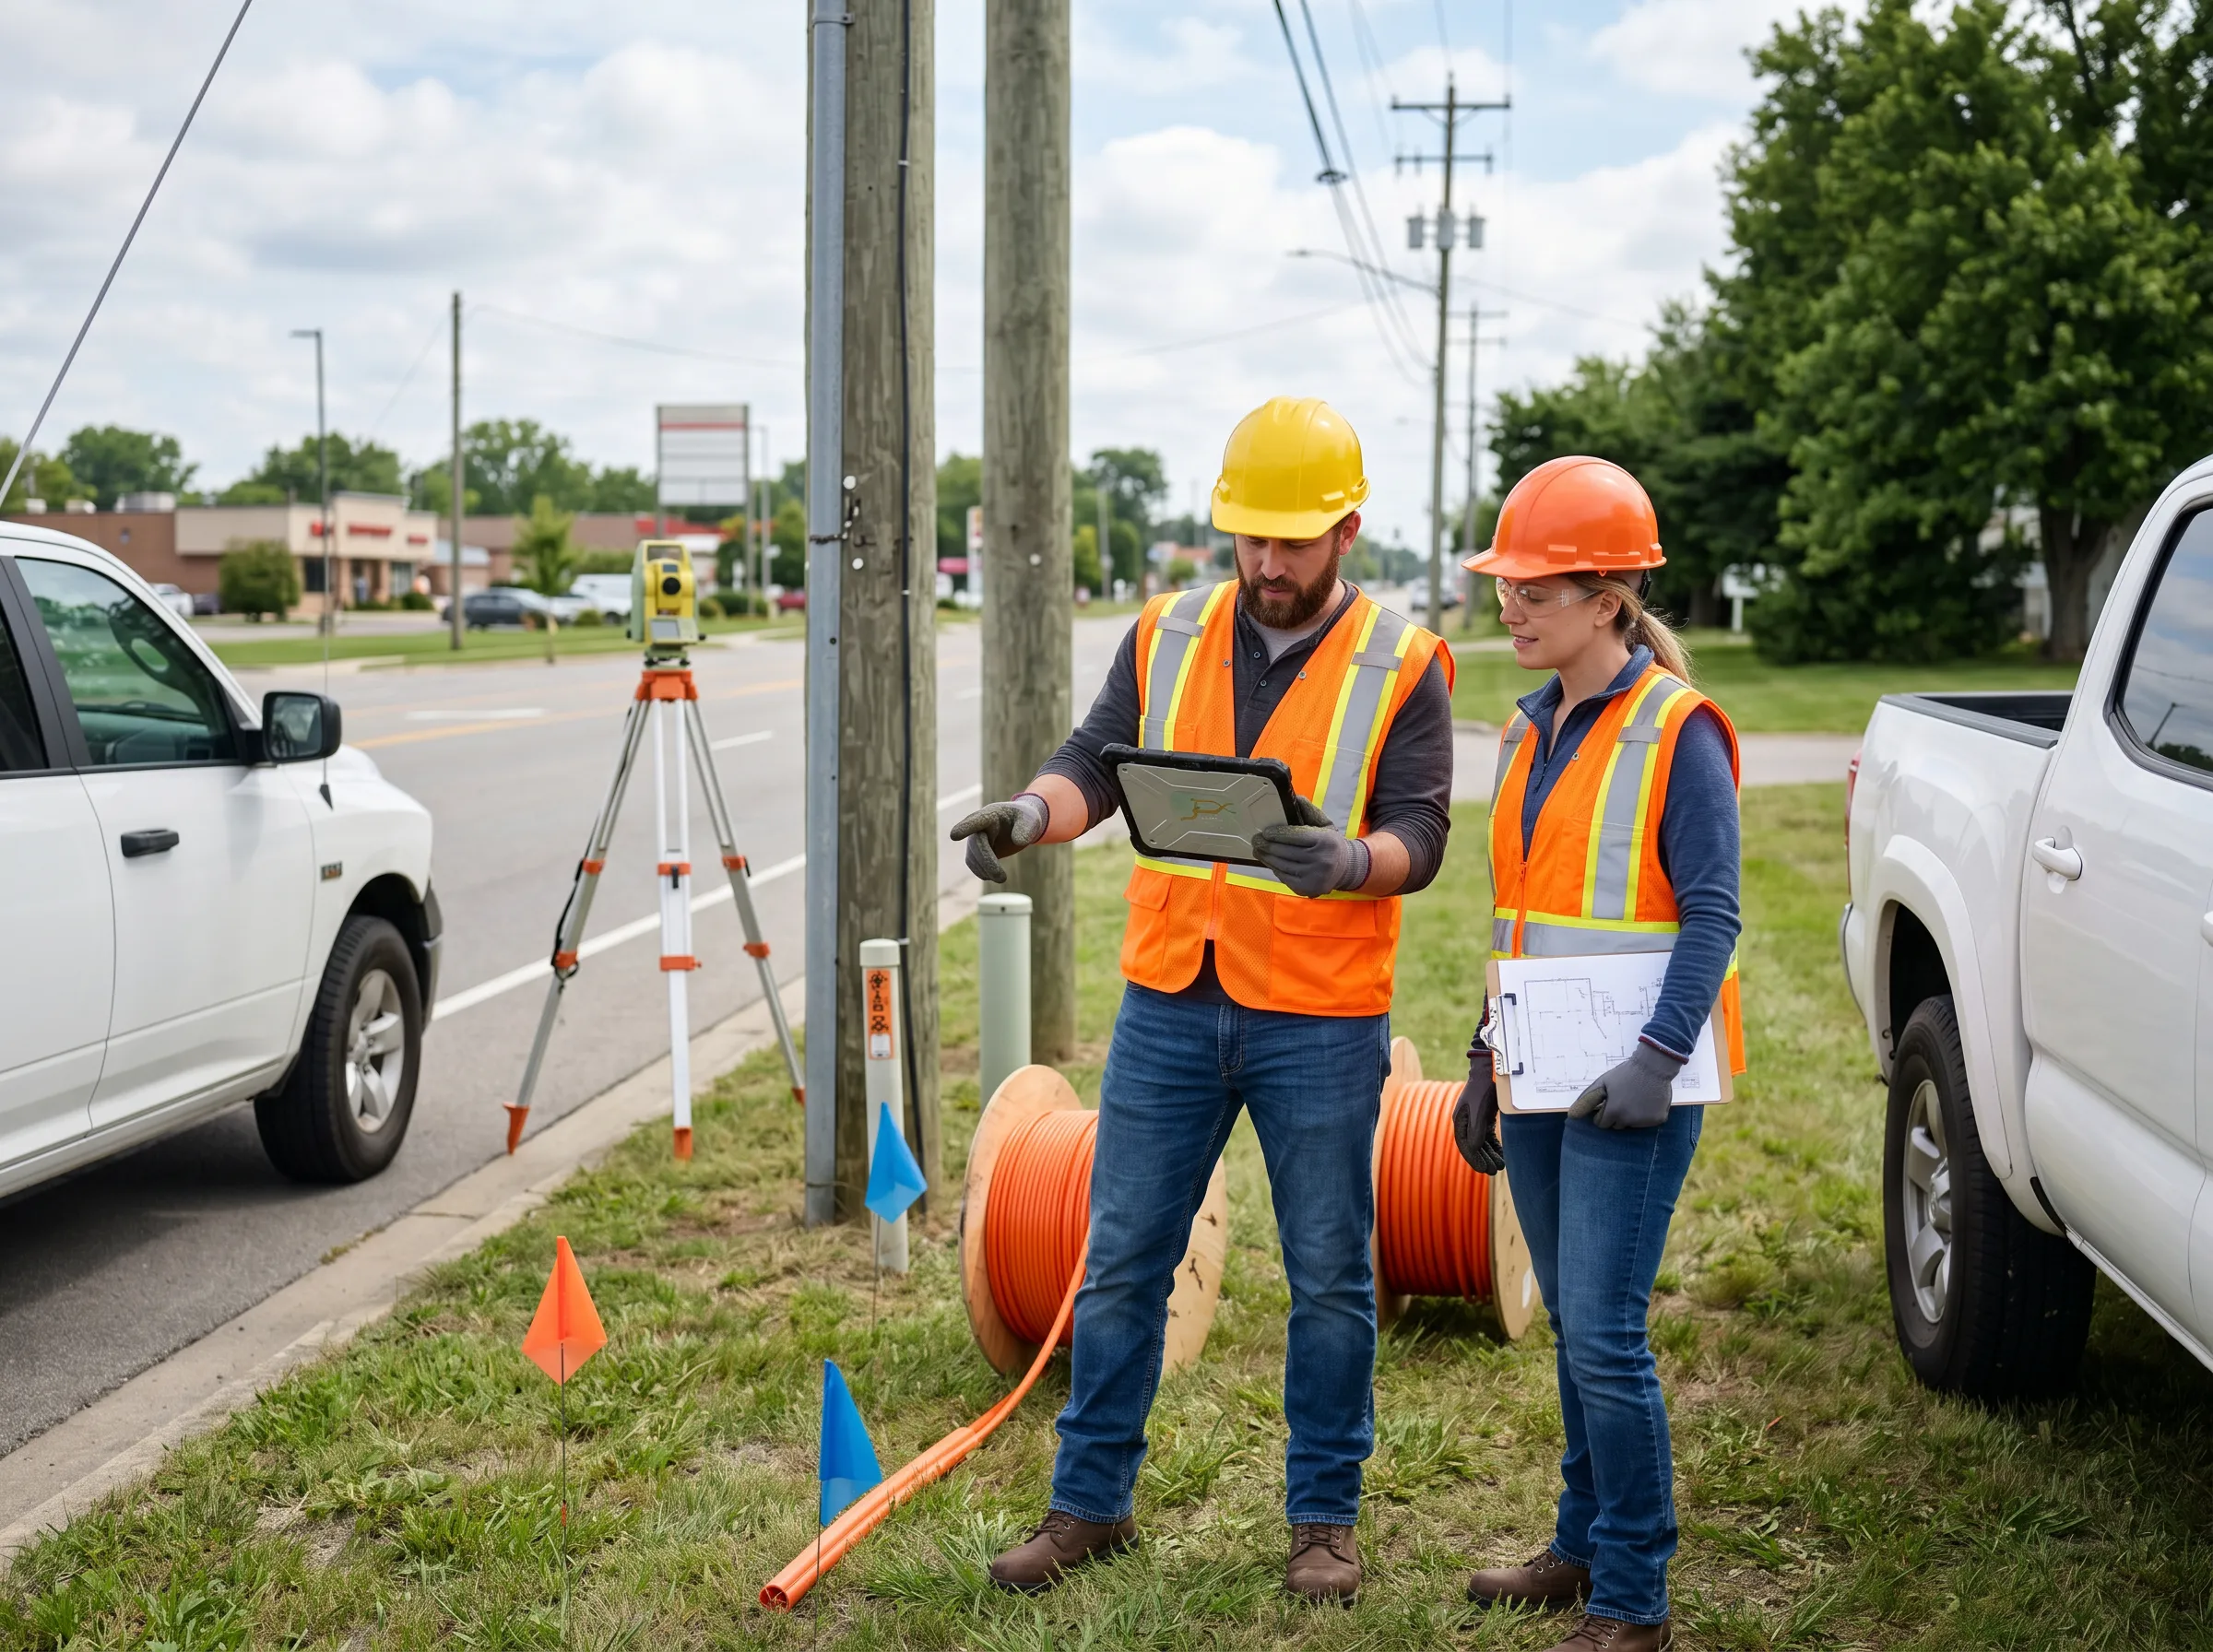
Empowering Every Role in the Telecom Value Chain
From route survey to network operations, we provide a unified geospatial system of record - connecting field crews and synchronizing data across your entire infrastructure rollout.


Problem / positioning
Telecom Projects Don’t Struggle from a Lack of Data. They Struggle Because Data Stays Disconnected
Route alignments live in GIS. Construction progress lives in spreadsheets. Splice validations and OTDR tests live in PDFs. Material tracking lives somewhere else entirely. TaskMapper brings it all together in one platform-so every team works from the same live reality, asset hierarchy, and workflow history.
From pre-construction to operations, your teams get one connected system instead of disjointed manual processes, siloed tools, and paper-based reporting.


Digital twin
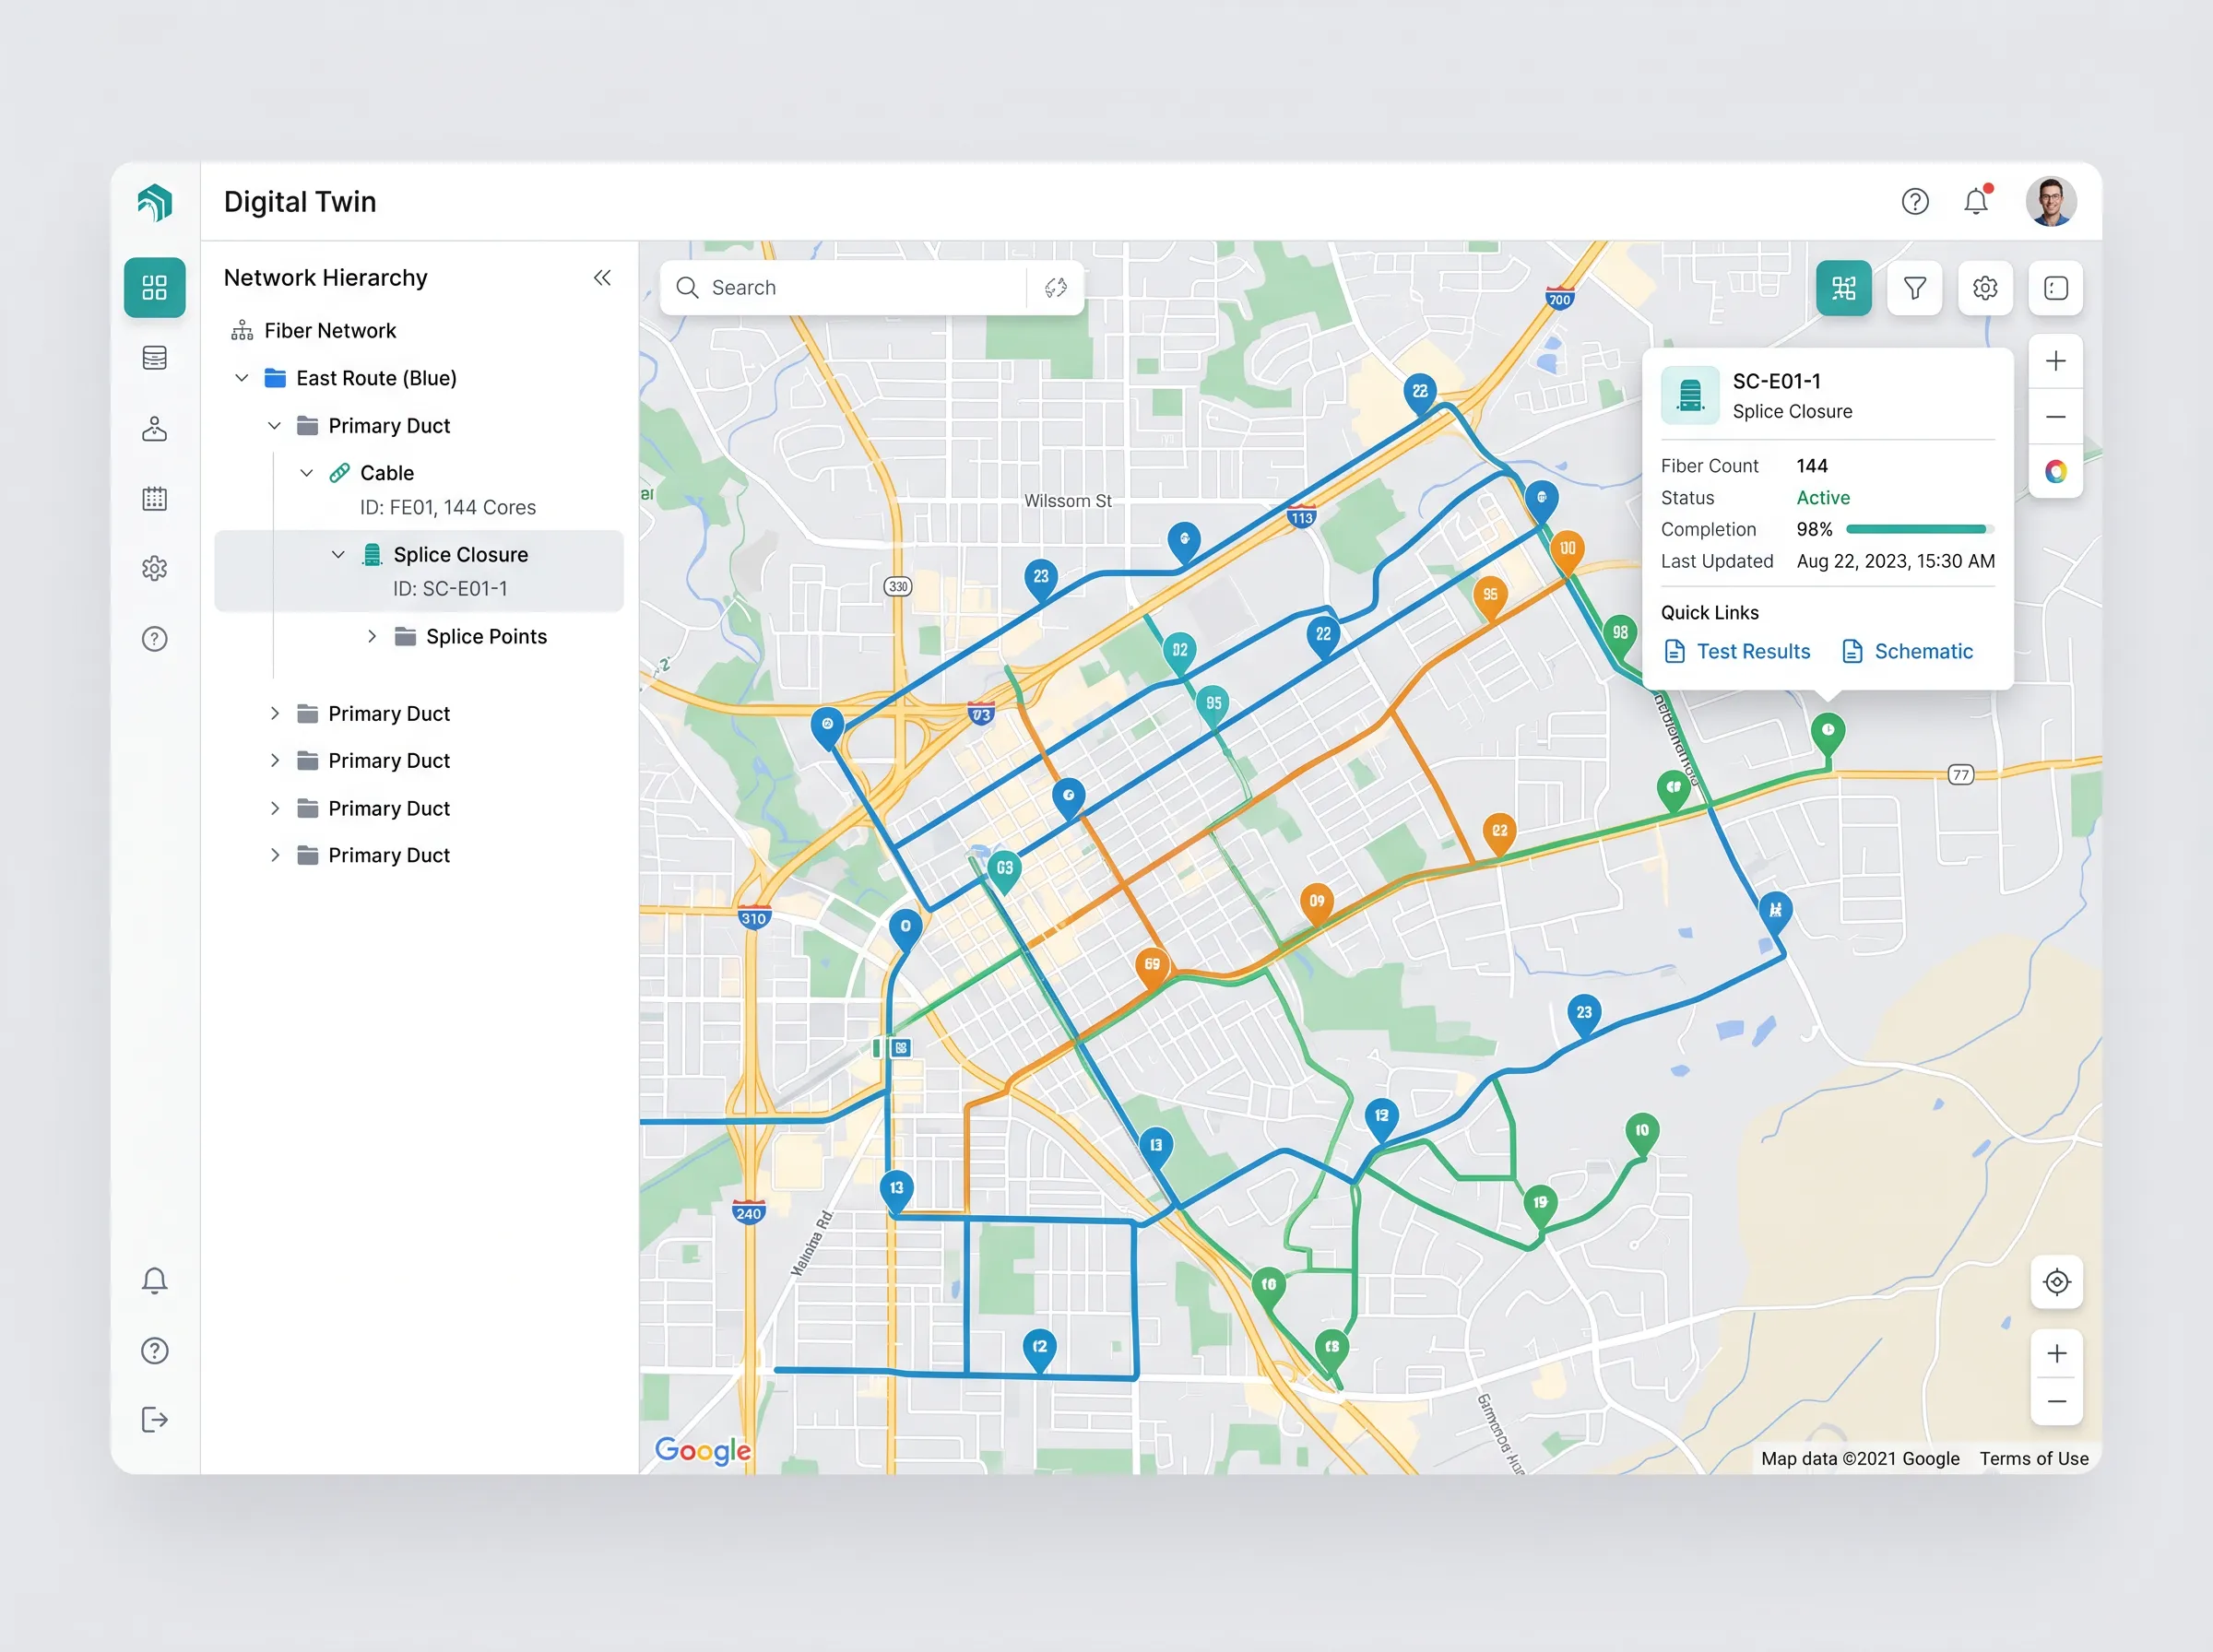
Spatial Twin
Bring together GIS layers, route data, drone imagery, and design-vs-as-built context in an interactive, Google Maps-like geospatial view.
Network Asset Twin
Track serialized components with warranties, OTDR traces, splice logs, and material consumption records linked to each exact network element.
Process Twin
Digitize trench depth forms, duct pressure tests, NCRs, and approvals-then connect those workflows directly to the precise location on site.


Mobile + AI
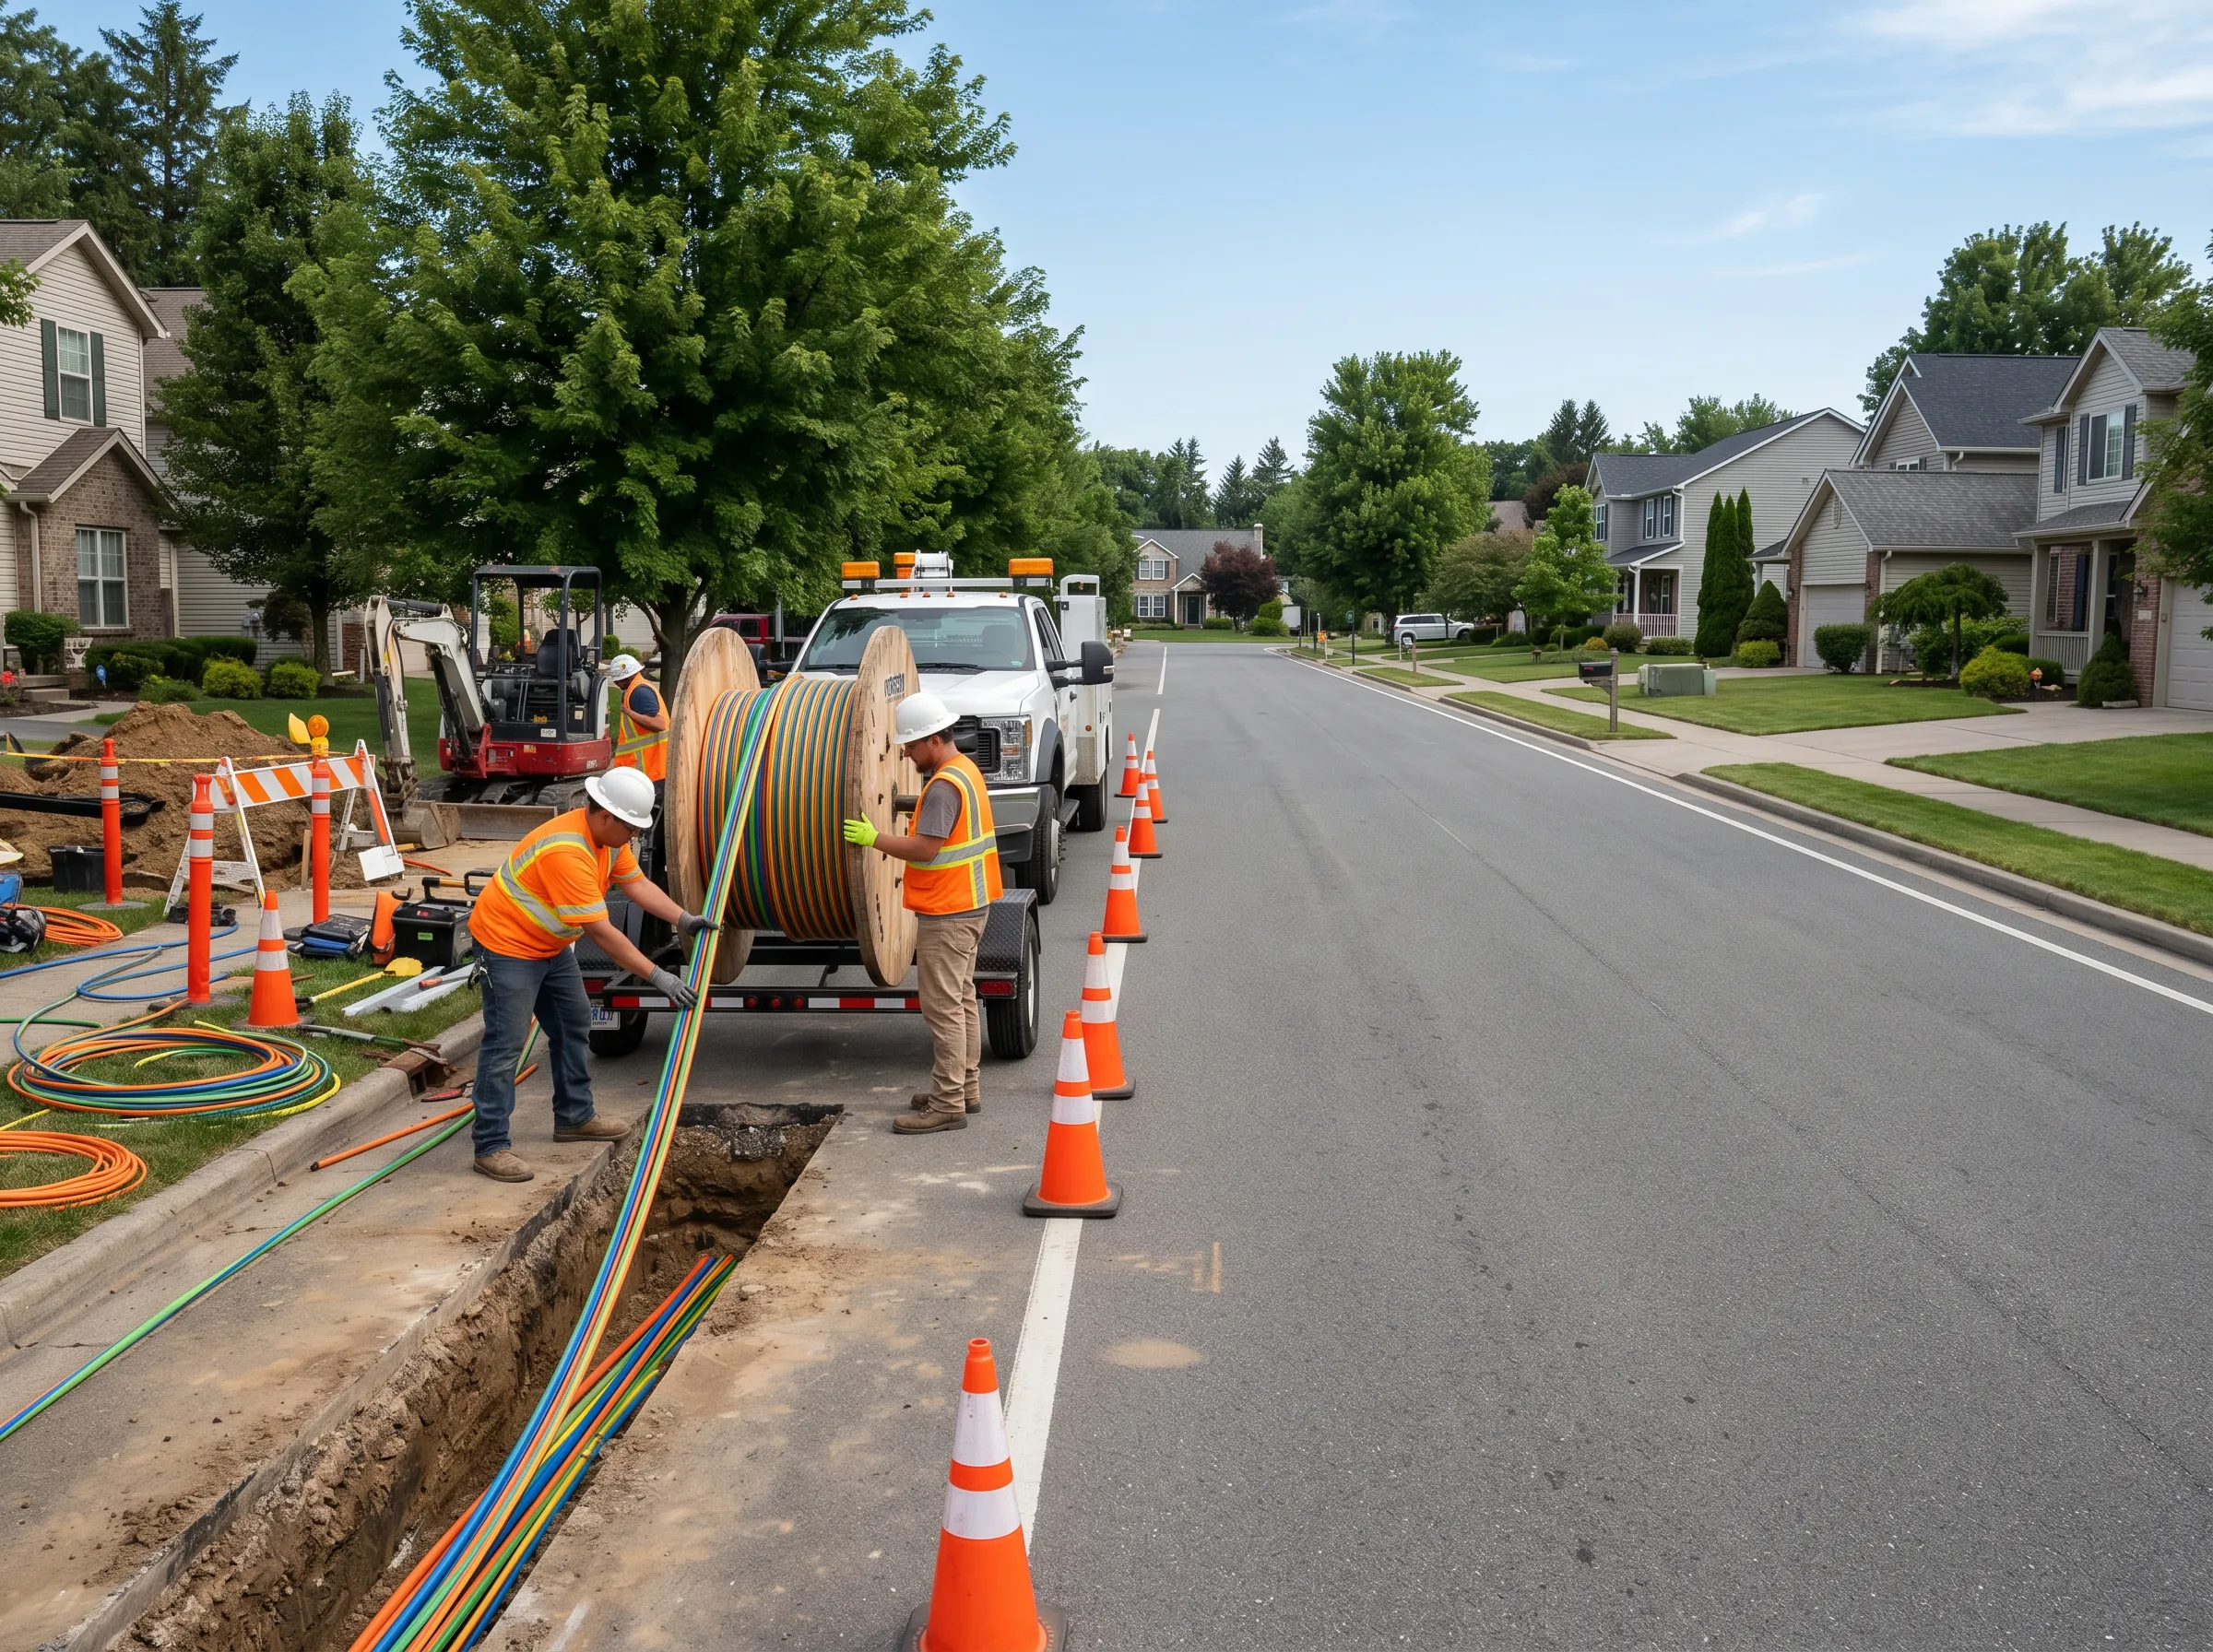
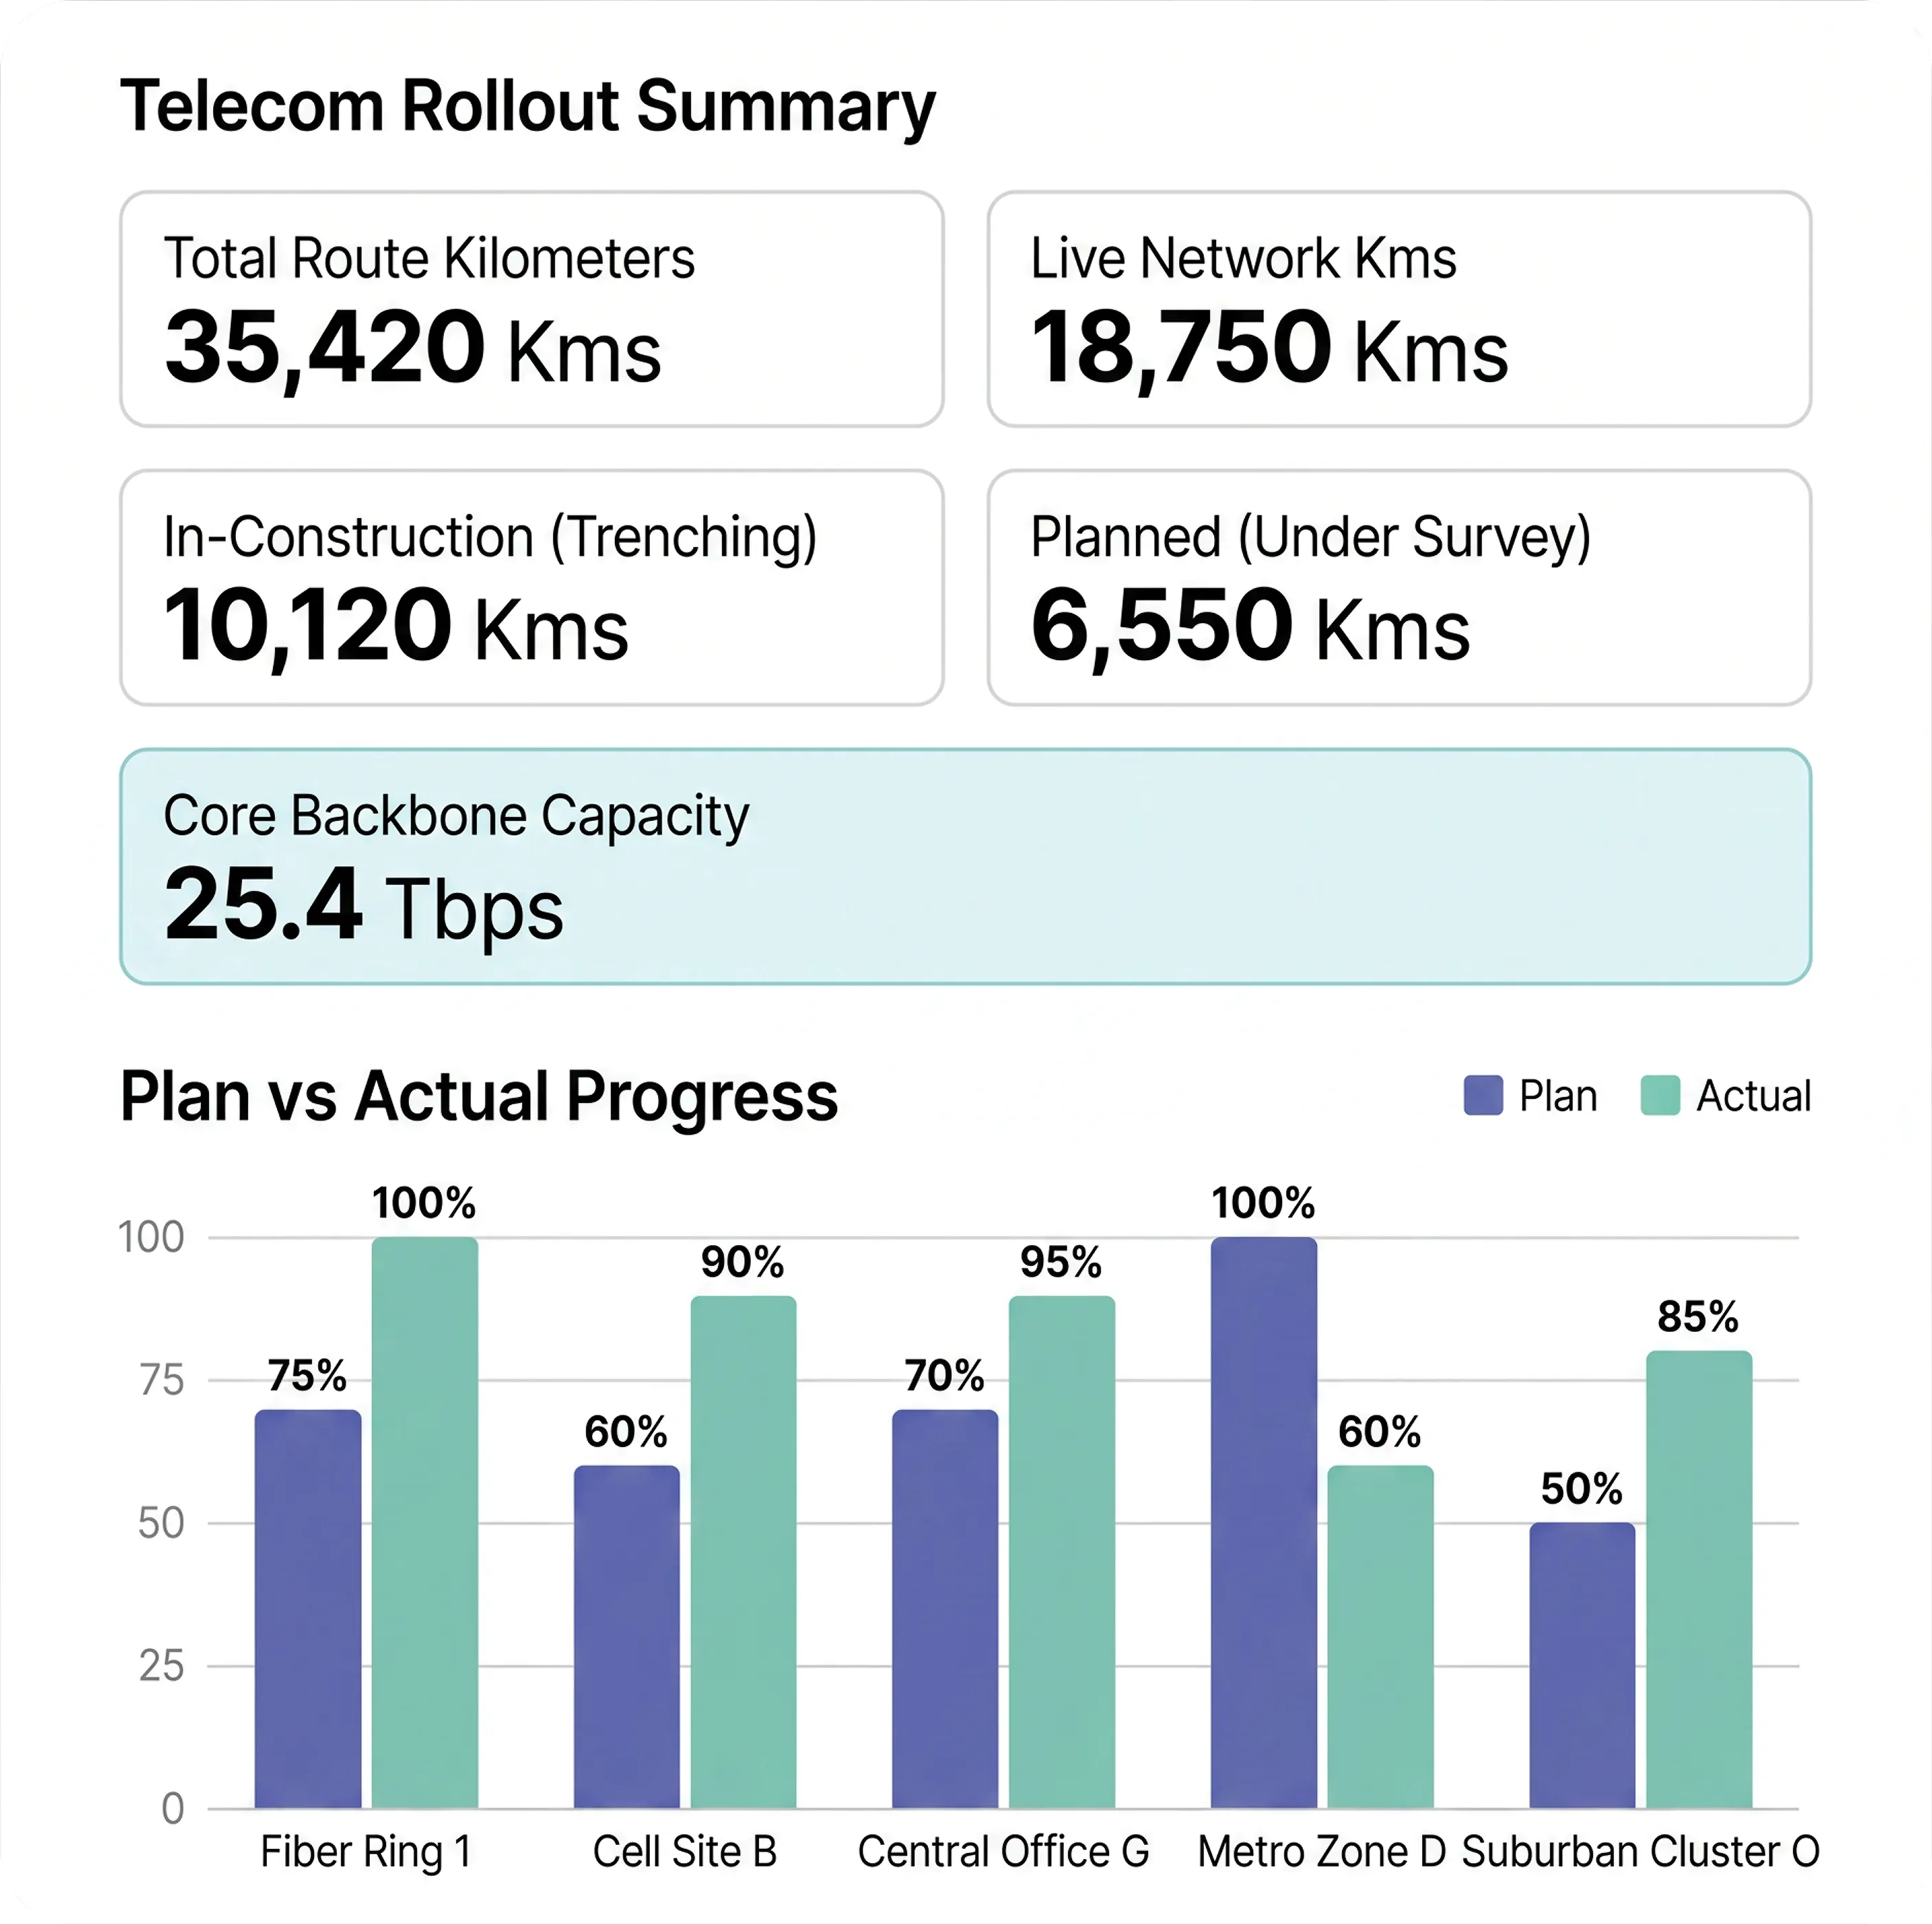
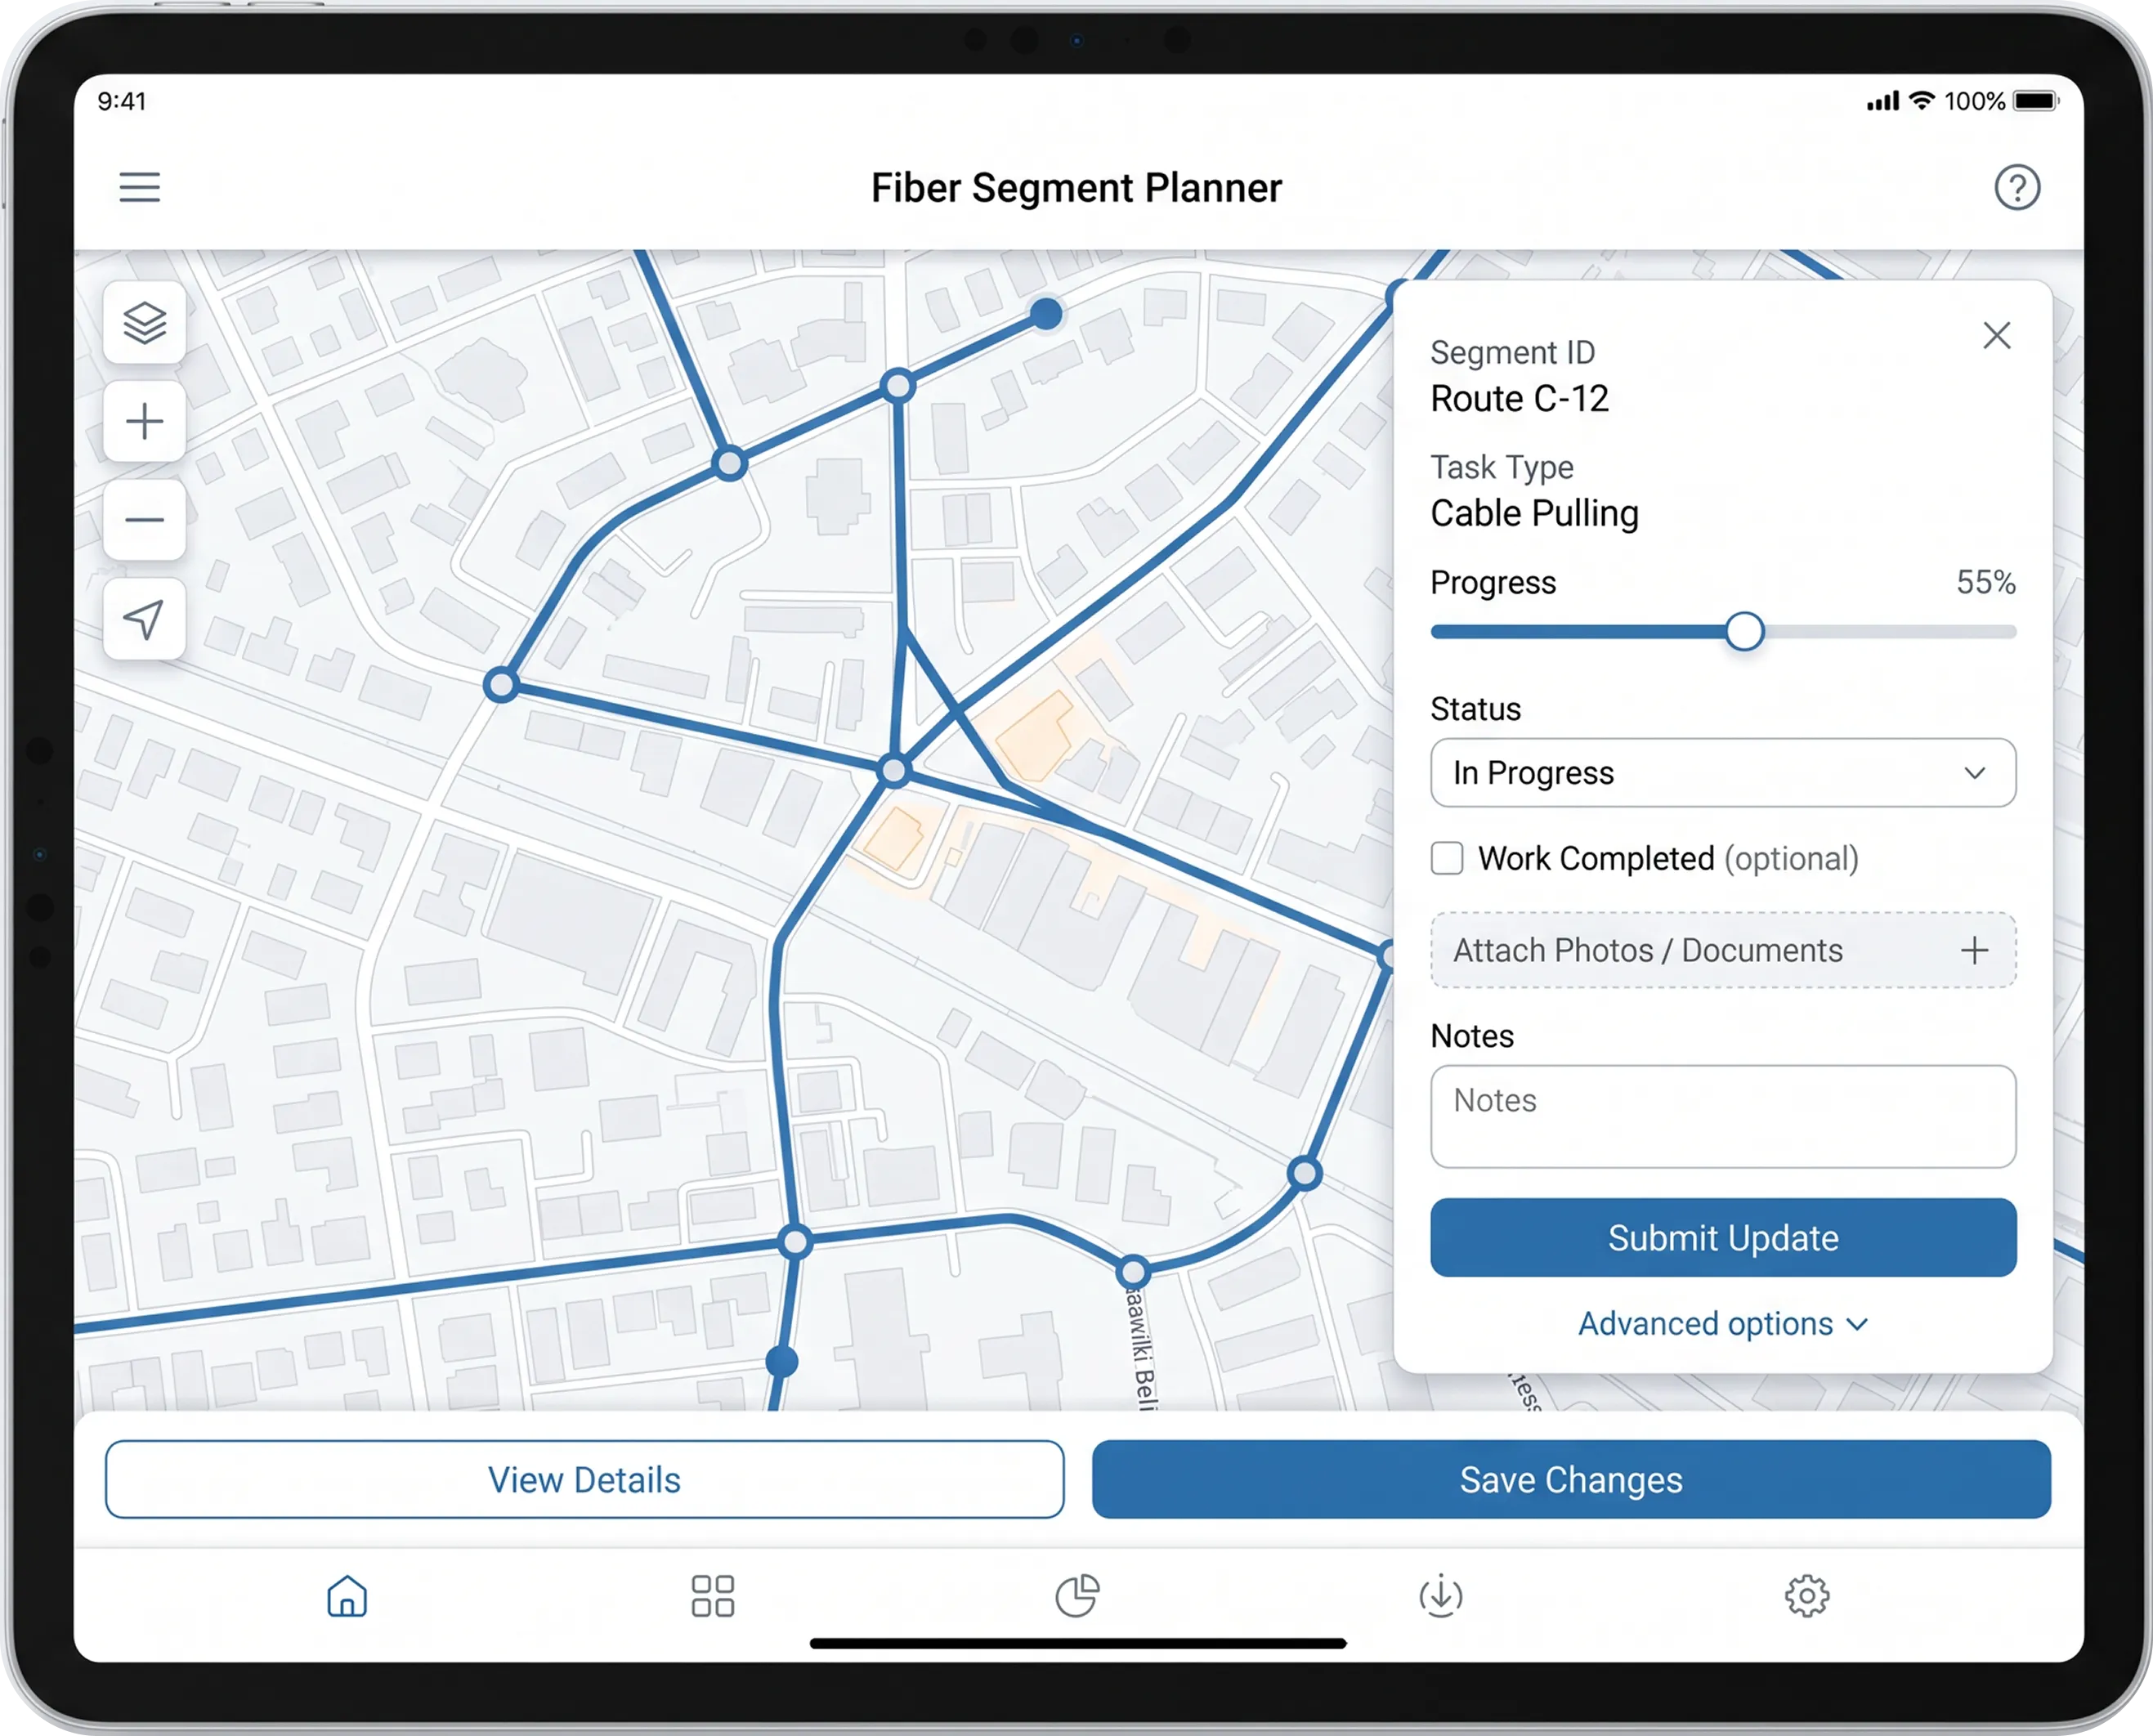
Field-Ready for Crews. Decision-Ready for Telecom Leaders.
Site technicians can navigate fiber routes, execute geo-referenced work orders, capture trenching updates, upload geo-tagged photos, complete QA/QC forms, and attach splice or OTDR evidence directly from the field - even offline. Managers get live route maps, planned vs. actual progress, contractor performance views, quality status, and schedule risk insights. With NaaviX AI, teams can ask natural-language questions and move from field updates to faster rollout decisions.
NaaviX Prompt Examples
Where is trenching behind schedule across active fiber routes?
Do we have enough fiber reels and splice kits for next week’s plan?
Which splice closures are waiting for OTDR validation before handover?
Why SenseHawk
Built for Telecom. Not Adapted for It.
Generic construction tools were never designed for utility-scale telecom. See how SenseHawk compares where it matters most.
Outcomes
Reduce delays with proactive alerts and real-time geospatial tracking of contractor progress.
Cut rework and ensure compliance through digital QA/QC forms, standardized checklists, and geo-tagged evidence.
Accelerate service activation with connected OTDR test data and faster digital commissioning workflows.
Optimize material management with end-to-end traceability of fiber reels and splicing kits to prevent idle crews.
Make better portfolio decisions with live dashboards, master schedule integration, and AI-driven insights.