Logo of a company with the name "Xsphere" in a modern design, featuring bold blue and green colors.
Aerial view of a large solar farm spread across rolling hills at sunset, with rows of solar panels and construction equipment visible on a dirt road.

Turn Solar Data into Portfolio Performance

SenseHawk provides a unified Digital Twin for the entire Solar O&M lifecycle. Integrate SCADA data with AI-driven thermal insights and GIS mapping to drive higher availability, lower OpEx, and maximum ROI.

Turn Solar Data into Portfolio Performance

SenseHawk provides a unified Digital Twin for the entire Solar O&M lifecycle. Integrate SCADA data with AI-driven thermal insights and GIS mapping to drive higher availability, lower OpEx, and maximum ROI.

Turn Solar Data into Portfolio Performance

SenseHawk provides a unified Digital Twin for the entire Solar O&M lifecycle. Integrate SCADA data with AI-driven thermal insights and GIS mapping to drive higher availability, lower OpEx, and maximum ROI.

Built for the field, trusted by enterprises

Built for the field, trusted by enterprises

Built for the field, trusted by enterprises

image

The Pain Statement

Stop Reacting to Alerts. Start Managing Assets.

Stop Reacting to Alerts. Start Managing Assets.

In utility-scale solar, the problem isn’t a lack of data - it’s the "Alert Fatigue" caused by disconnected systems. When SCADA data, thermal reports, and maintenance logs live in different silos, your bottom line suffers. SenseHawk solves the three biggest O&M hurdles:

In utility-scale solar, the problem isn’t a lack of data - it’s the "Alert Fatigue" caused by disconnected systems. When SCADA data, thermal reports, and maintenance logs live in different silos, your bottom line suffers. SenseHawk solves the three biggest O&M hurdles:

The "Truck Roll" Waste

Stop sending crews to a 500MW site without knowing exactly where a fault is or what tools are needed.

Invisible Revenue Loss

Identify bypassed strings and subtle underperformance that traditional SCADA misses.

The Warranty Gap

Stop losing OEM claims due to lack of historical health data or evidence-backed maintenance records.

The Intelligent O&M Backbone

Predictive Tools for High-Yield Operations.

Five integrated capabilities that turn disconnected O&M data into a single, actionable intelligence layer across your entire solar portfolio.

GIS-Mapped Asset Management

View your entire portfolio on a Geospatial Map. Click any inverter to see real-time health and history.

A woman in a modern office sits at a desk, working on a computer displaying a solar asset portfolio dashboard with charts and data.
AI Thermal Analysis

Automatically detect and categorize anomalies (Hotspots, Diode failures) using Therm AI, mapped to the IEC 62446 standard.

Two construction workers in safety vests and helmets stand at a solar farm, reviewing a tablet while heavy equipment operates in the background.
Field Service Sync

Dispatch technicians with Mobile GIS maps that guide them to the exact coordinate of the fault - even offline.

Two professionals in a control room review a wall-mounted screen displaying solar system diagnostics and asset information.
Preventative Workflows

Move from reactive repairs to optimized Preventative Maintenance (PM) schedules based on actual asset health.

A solar field worker wearing a helmet and safety vest stands in front of solar panels, holding a tablet showing performance charts.
CMMS & ERP Integration

Seamlessly flow field data into your existing maintenance and financial systems via our robust APIs.

A solar field worker wearing a helmet and safety vest stands in front of solar panels, holding a tablet showing performance charts.
Worker in a hard hat and safety vest holding a tablet at a solar farm construction site, with rows of solar panels, cranes, and crew members working in the background at sunset.

Portfolio Intelligence

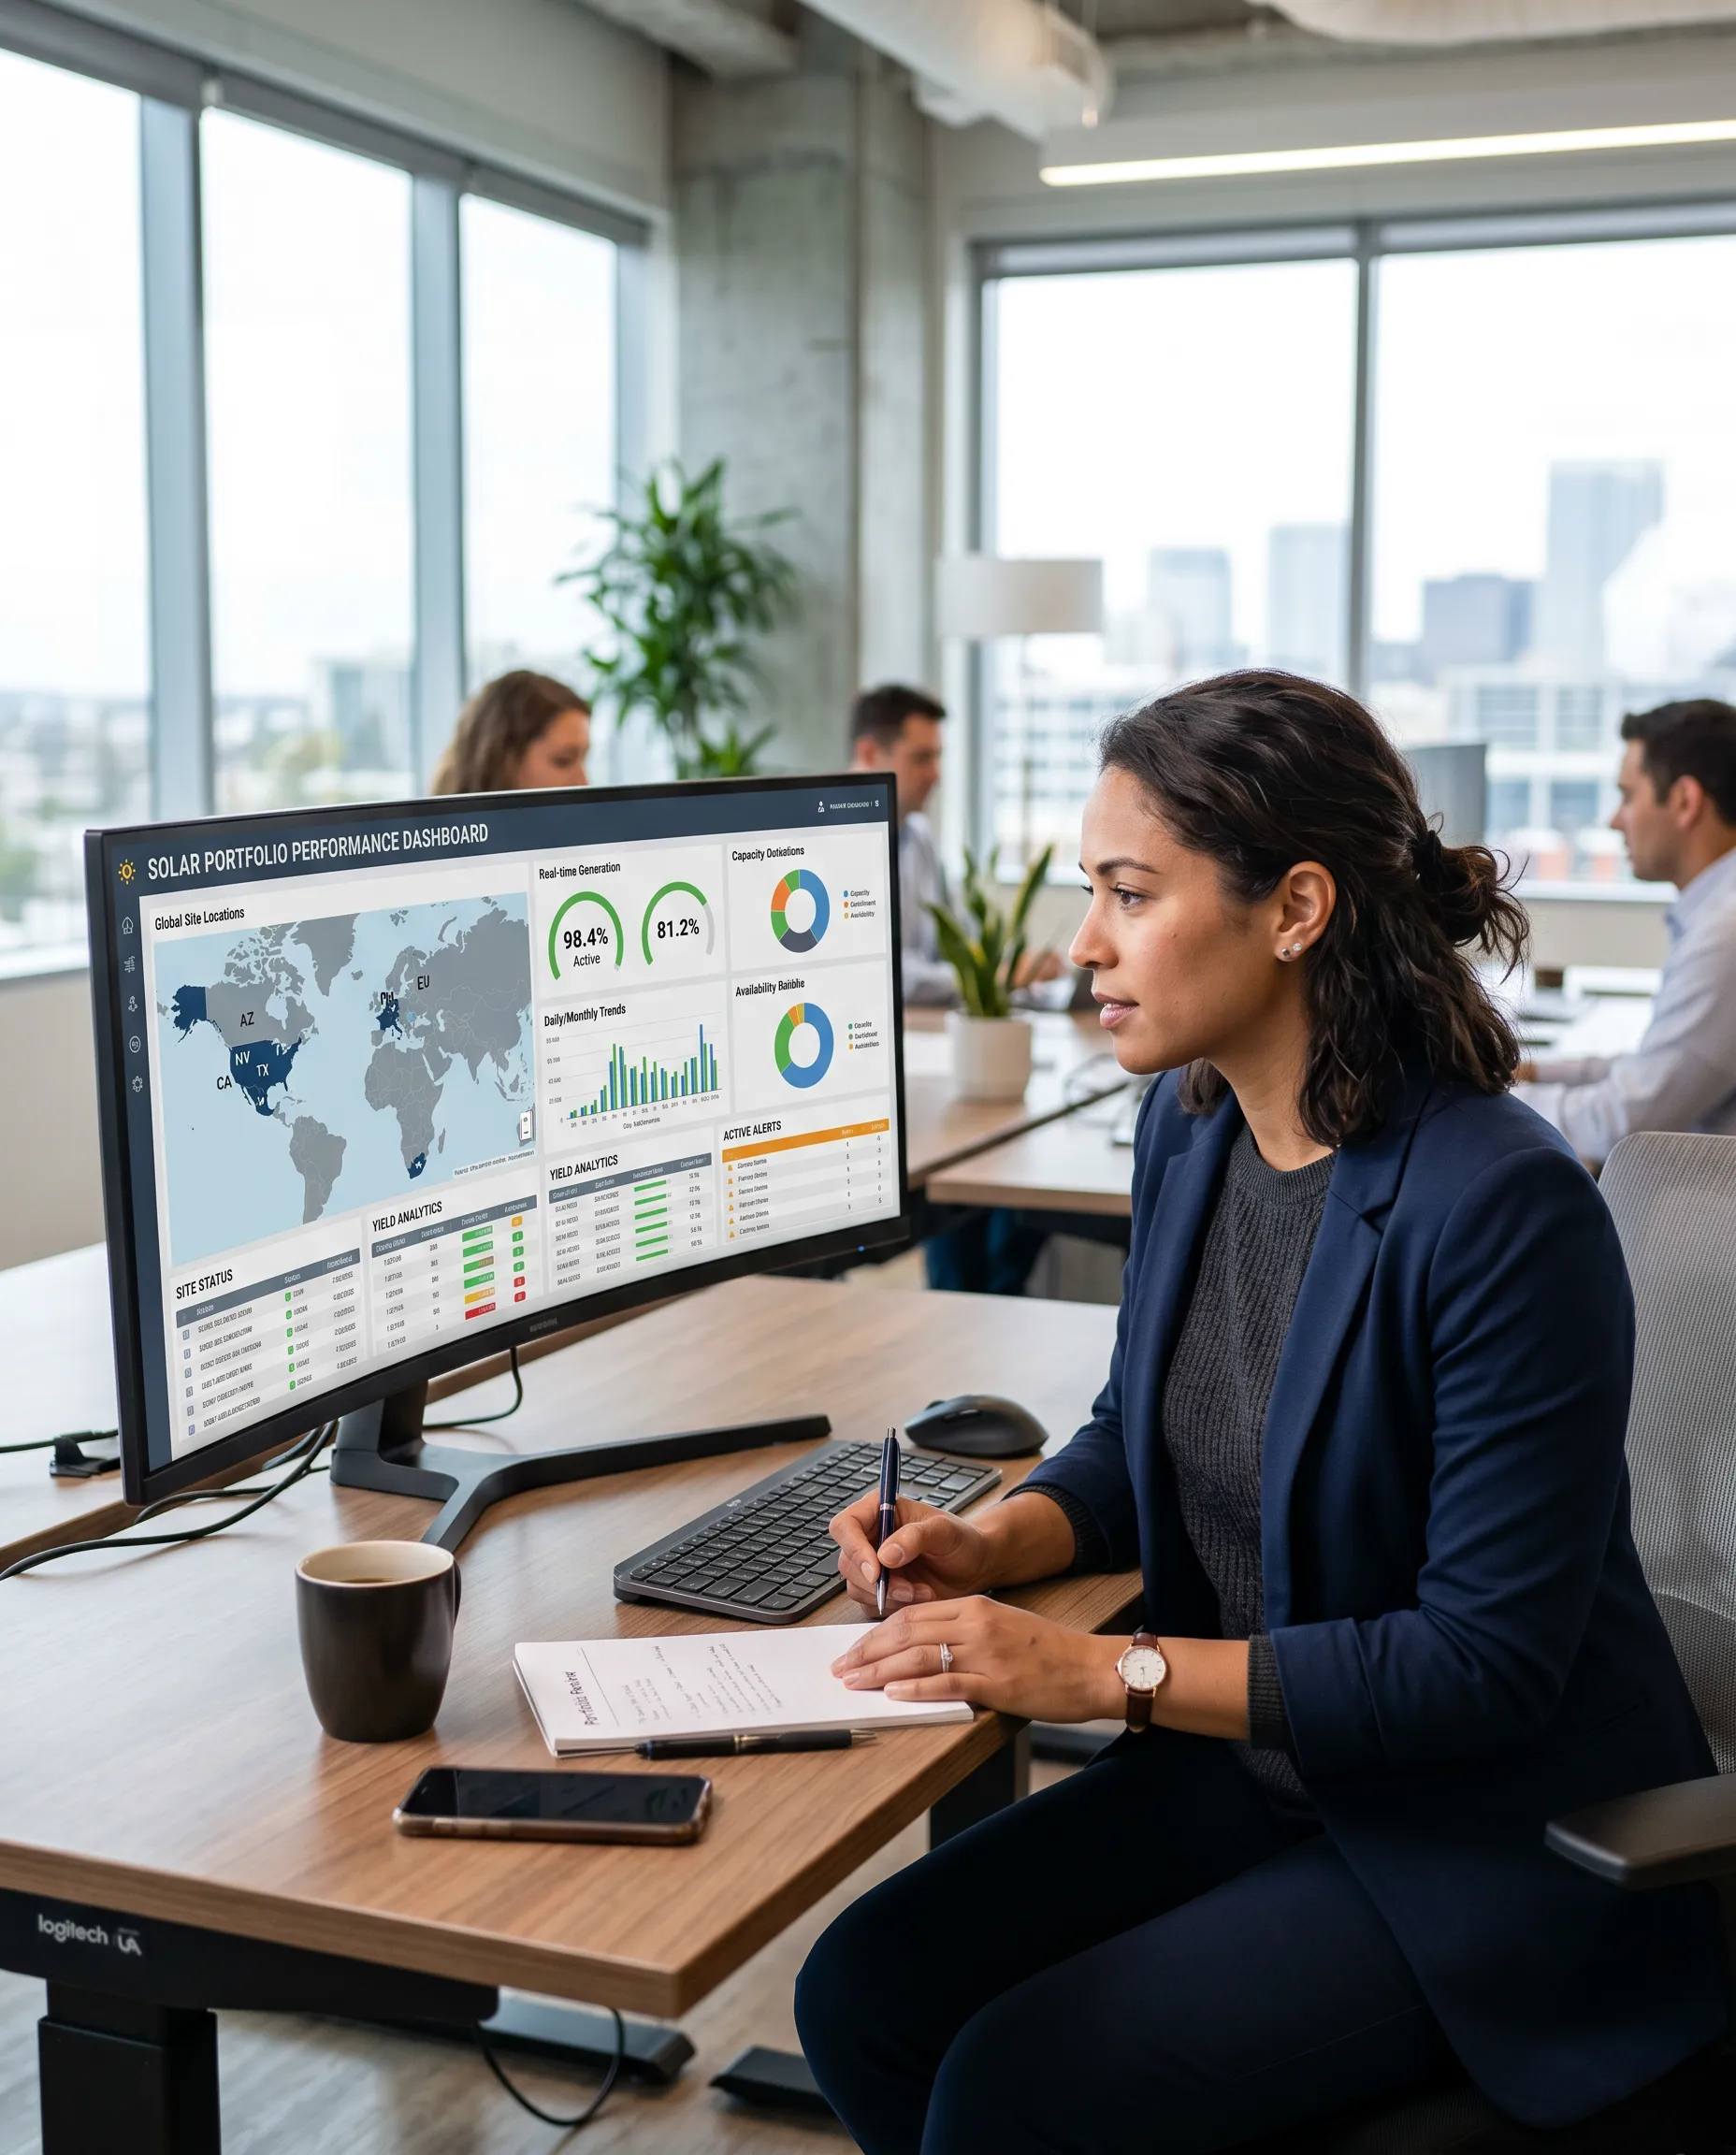
From Portfolio Visibility to String-Level Action

Don't get buried in spreadsheets. SenseHawk aggregates millions of data points into executive portfolio views while allowing your technical team to drill down to a specific string or module in seconds.

Executive Portfolio View

Roll up performance ratio, availability, and revenue loss across all sites into a single leadership dashboard - no manual consolidation required.

Inverter & String Drill-Down

Click from portfolio level straight to a specific inverter or string to see real-time health, historical trends, and active fault status.

SCADA Context Layer

Go beyond raw SCADA alerts. SenseHawk adds spatial and asset context so your team knows not just what failed - but exactly where and why.

Built for Utility-scale Complexity

of Solar and Storage Supported

0+ GW

of Solar and Storage Supported

0+ GW

Increase in annual energy yield (AEP)

0-5%

Increase in annual energy yield (AEP)

0-5%

Reduction in O&M truck rolls

0%

Savings per 100 MW Project

$0k

Savings per 100 MW Project

$0k

AI-Ready Asset Intelligence

Ask NaaviX: "How is My Portfolio Performing?"

SenseHawk structures your historical O&M data, making your assets "AI-ready." Use natural language to query your portfolio and identify trends that human analysis might miss.

Try Asking

"Which site in my portfolio has the highest revenue loss due to soiling?"

"Show me all tracker failures across the US portfolio from last month."

"What is the projected ROI of performing a full thermal scan this quarter?"

A man sits at a desk in an office, working on a computer that displays data dashboards and charts. Through a large window behind him, a group of workers in safety vests are installing solar panels at an outdoor site.

Frequently Asked Questions

How does a Digital Twin help O&M teams?

Can SenseHawk integrate with my existing CMMS?

How do you detect underperforming strings?

Engineer in safety gear standing beside solar panels at sunset on a solar farm site.

Maximize the Life of Your Solar Assets.

Eliminate the reporting burden and start owning the outcome. Discover why the world’s leading IPPs trust SenseHawk for their O&M.

Engineer in safety gear standing beside solar panels at sunset on a solar farm site.

Maximize the Life of Your Solar Assets.

Eliminate the reporting burden and start owning the outcome. Discover why the world’s leading IPPs trust SenseHawk for their O&M.

Engineer in safety gear standing beside solar panels at sunset on a solar farm site.

Maximize the Life of Your Solar Assets.

Eliminate the reporting burden and start owning the outcome. Discover why the world’s leading IPPs trust SenseHawk for their O&M.