Logo of a company with the name "Xsphere" in a modern design, featuring bold blue and green colors.
Aerial view of a large solar farm spread across rolling hills at sunset, with rows of solar panels and construction equipment visible on a dirt road.

Own The Outcome - Not The Reporting Burden

SenseHawk gives owners and IPPs a live, portfolio-wide system of record for solar assets. By unifying schedules, drone data, field inspections, and performance insights into a single digital twin, we help your team spot risks early and protect project margins.

Built for the field, trusted by enterprises

Built for the field, trusted by enterprises

Built for the field, trusted by enterprises

The Problem

Too Many Assets. Too Many Teams. Too Little Visibility.

Too Many Assets. Too Many Teams. Too Little Visibility.

For owners and IPPs, the challenge is not just building projects - it is maintaining control across EPCs, contractors, consultants, and operations teams. Critical project data often lives in siloed tools, inboxes, PDFs, and spreadsheets, making it hard to answer simple but important questions:

For owners and IPPs, the challenge is not just building projects - it is maintaining control across EPCs, contractors, consultants, and operations teams. Critical project data often lives in siloed tools, inboxes, PDFs, and spreadsheets, making it hard to answer simple but important questions:

Are we truly on schedule?

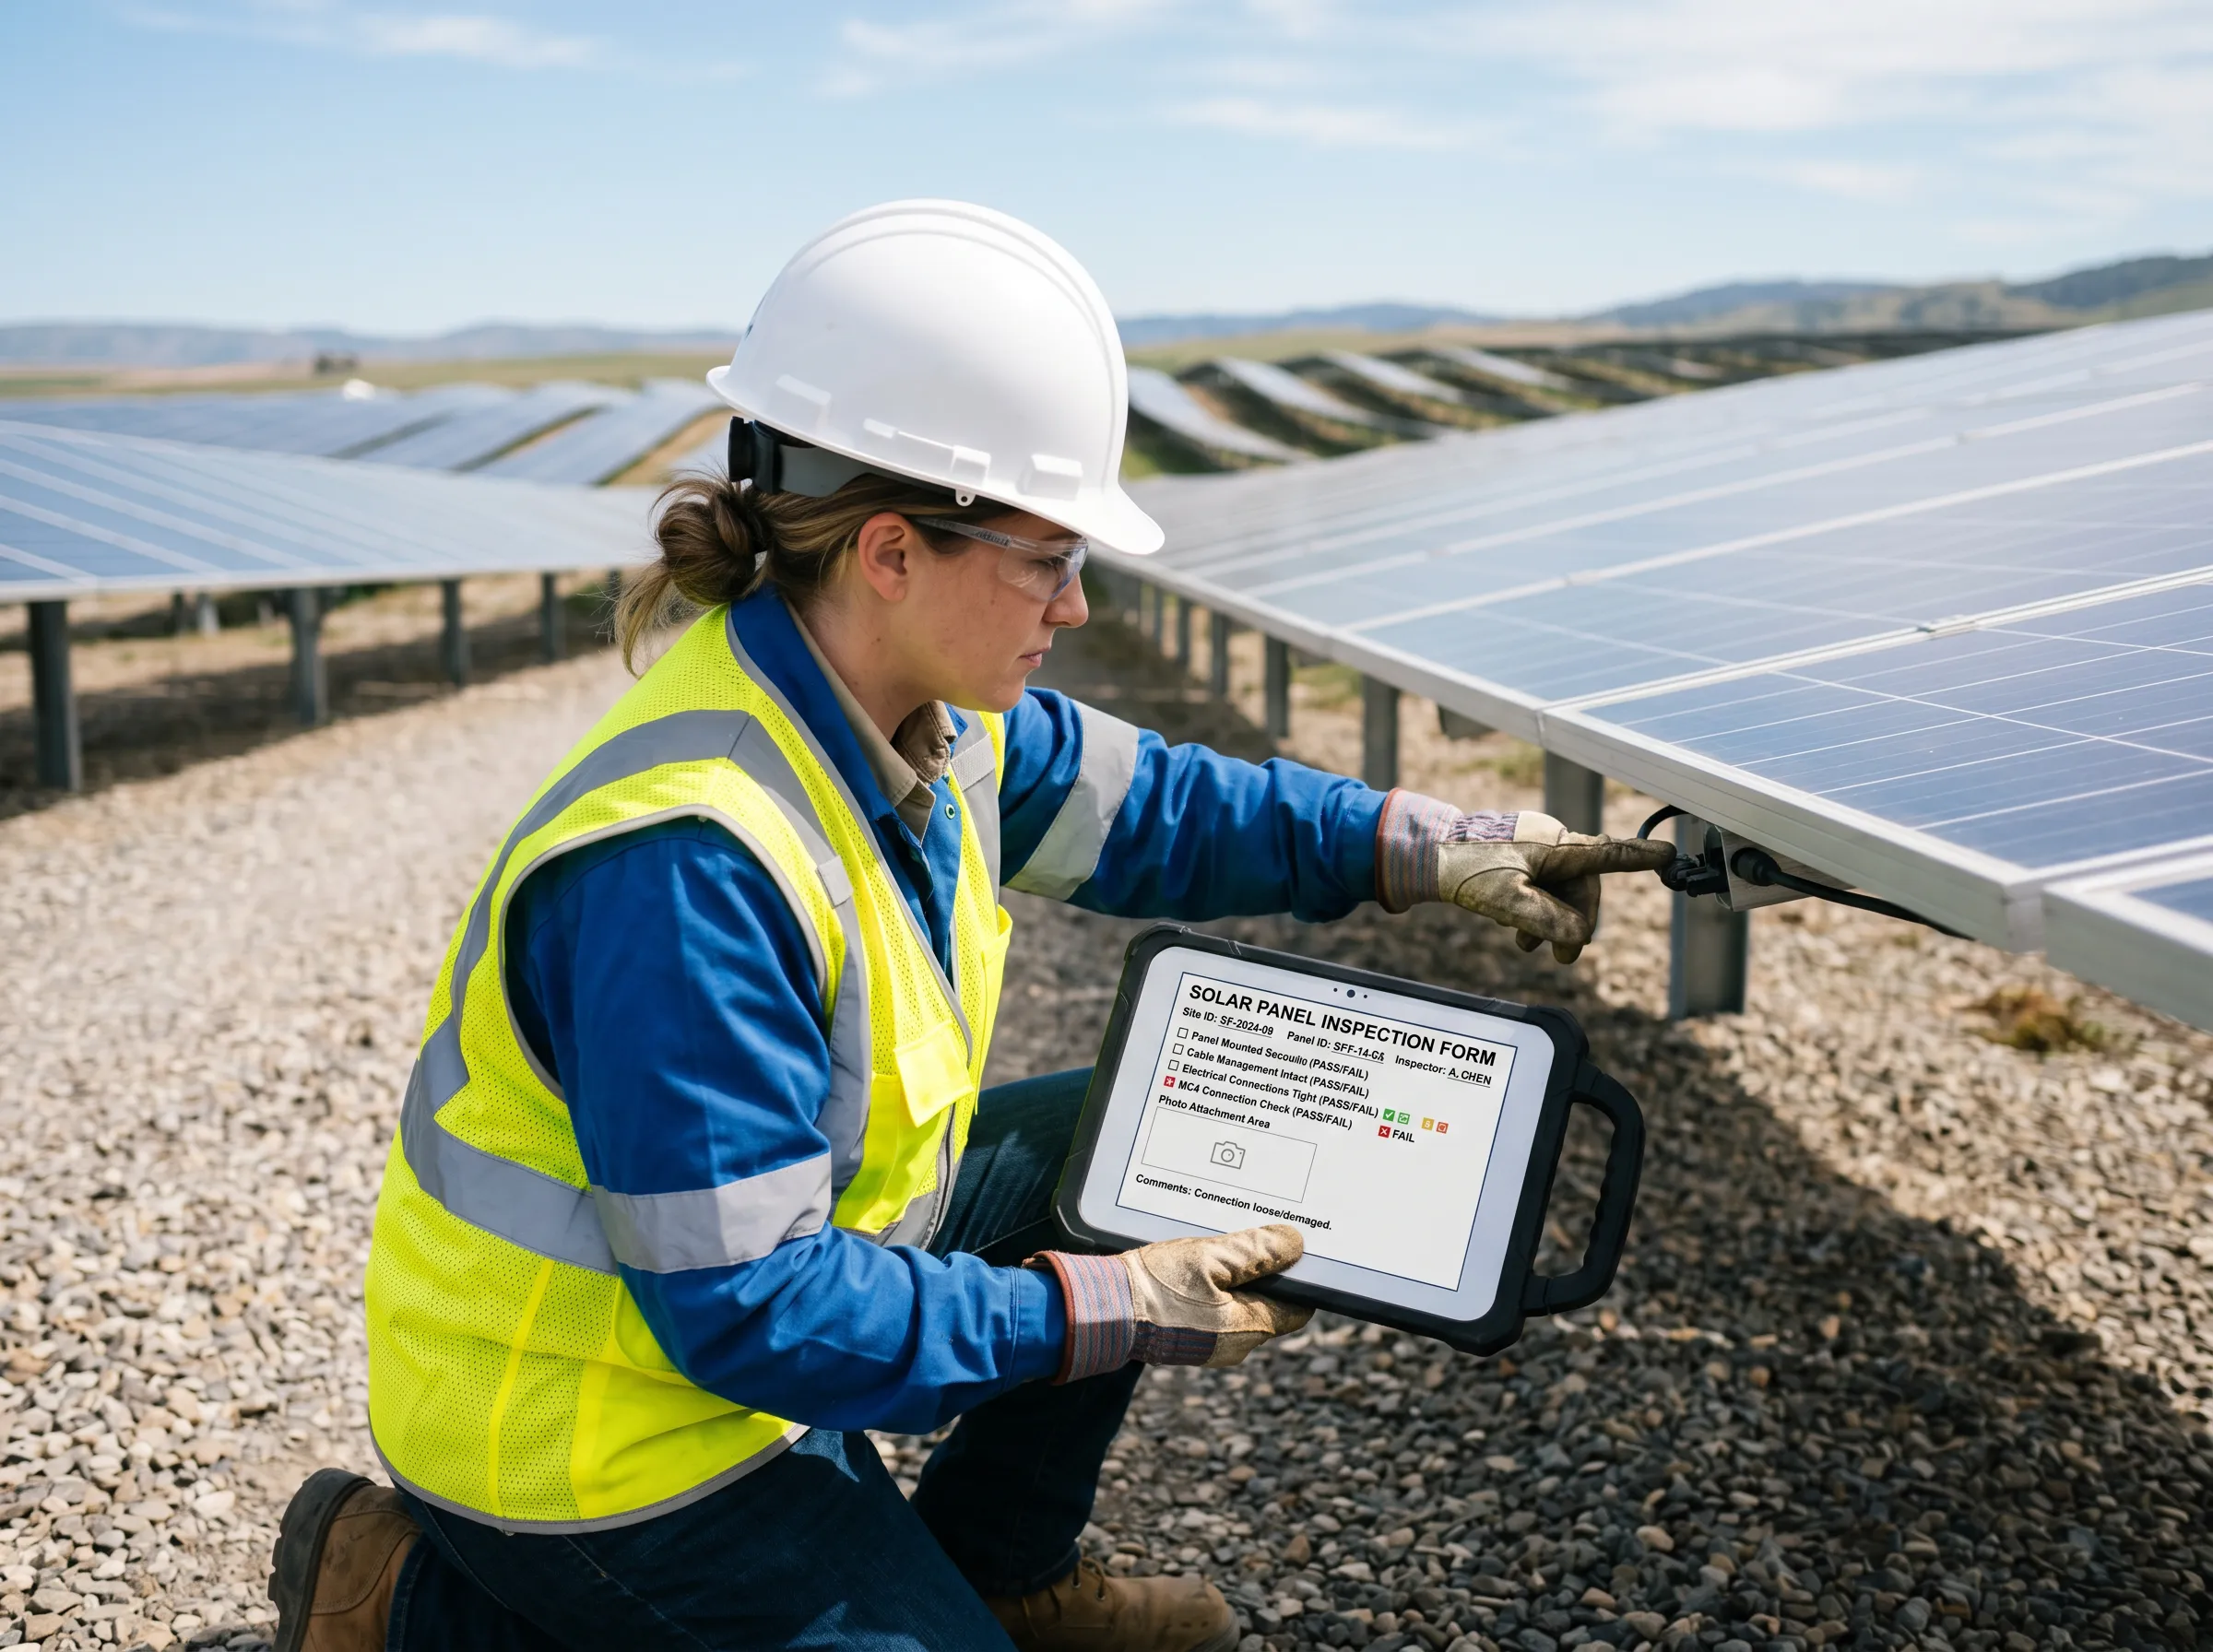
Where are the highest construction and quality risks?

Is handover data complete and trustworthy?

Which assets are underperforming, and why?

Where are warranty, compliance, or documentation gaps emerging?
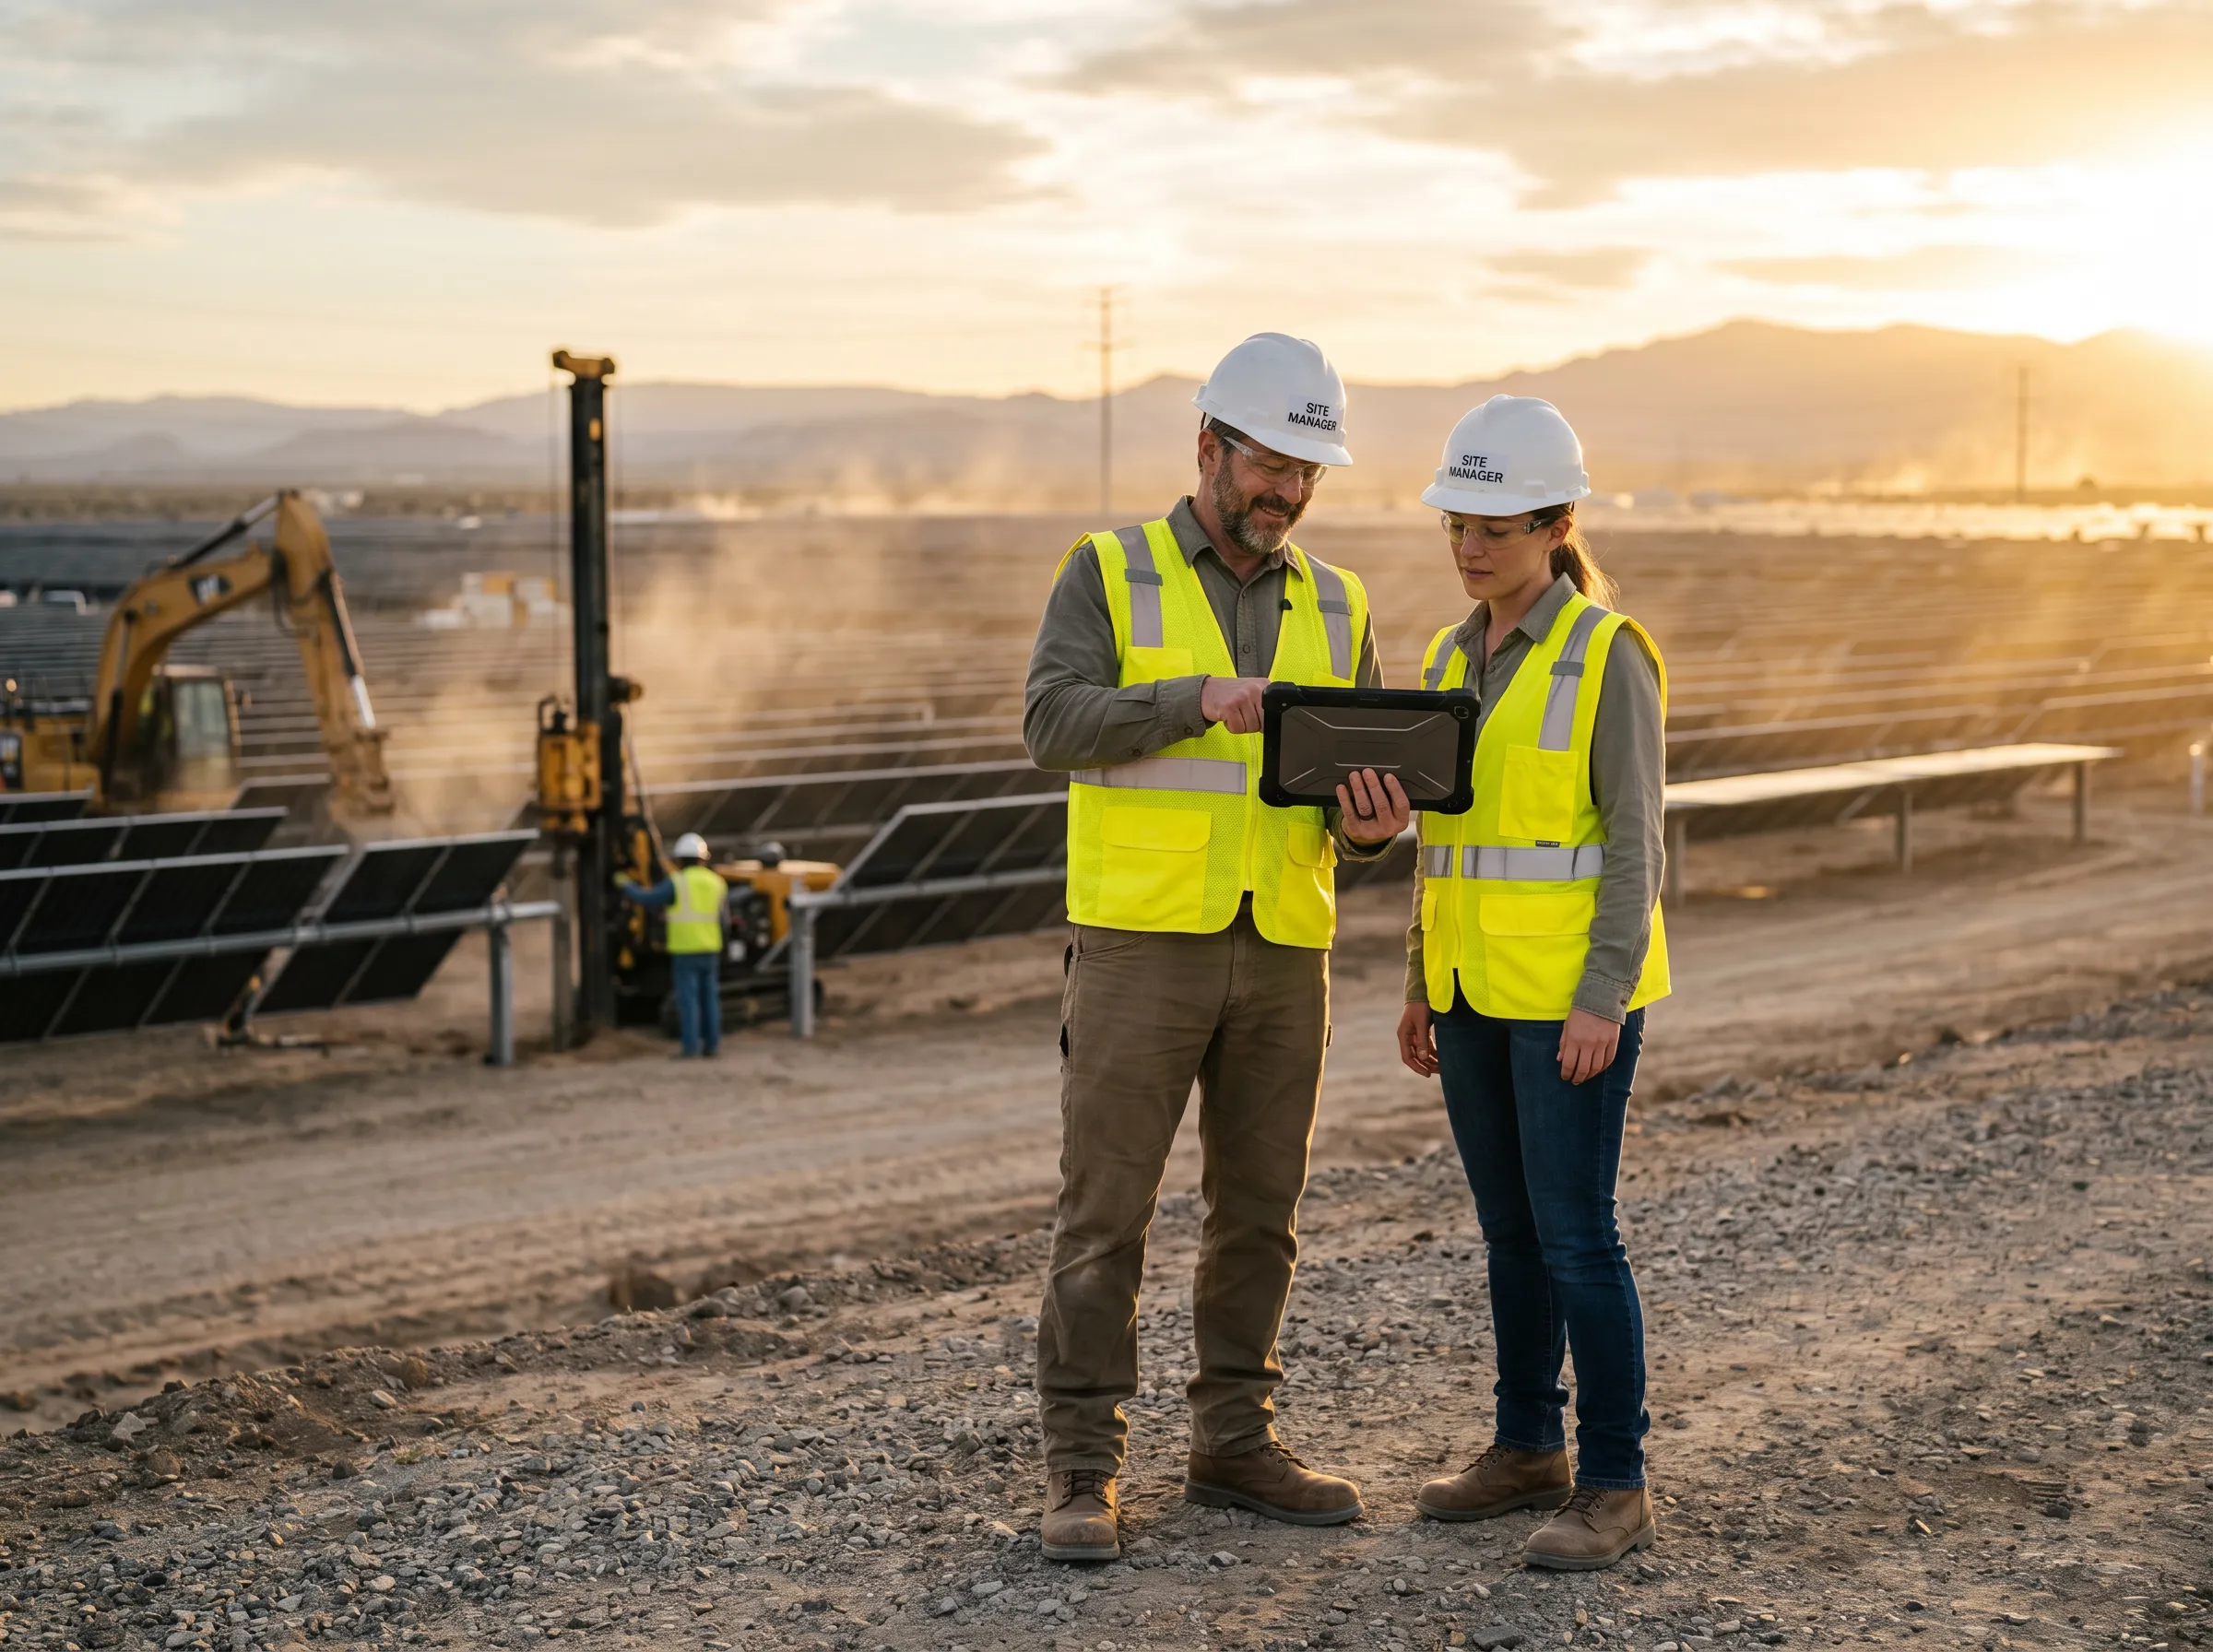
SenseHawk gives your team one source of truth across the full lifecycle, from pre-construction through O&M.

SenseHawk gives your team one source of truth across the full lifecycle, from pre-construction through O&M.

A woman works on a laptop displaying a global solar operations dashboard, seated at a desk in a bright office with solar panels visible outside the window.

Value Proposition

Built For Owner Control At Every Stage.

From portfolio dashboards to field execution, SenseHawk gives owners complete visibility and control across every phase of the solar asset lifecycle.

Portfolio Visibility

See every site, milestone, risk, and delay in one place. Get portfolio-level dashboards, live progress views, and site-level drill-downs without waiting for manual updates.

A woman in a modern office sits at a desk, working on a computer displaying a solar asset portfolio dashboard with charts and data.
Construction Oversight

Track progress against plan in real time. Connect schedules, field workflows, drone data, and inspections to monitor execution from first pile to last module.

Two construction workers in safety vests and helmets stand at a solar farm, reviewing a tablet while heavy equipment operates in the background.
Quality & Compliance

Turn inspections and records into auditable proof. Capture geo-tagged inspections, NCRs, punch lists, and approvals that stay tied to the right asset and workflow.

A technician in safety gear kneels beside solar panels, using a tablet to inspect and record performance data.
Handover Readiness

Receive a handover package that is complete, structured, and usable. Link as-builts, test results, datasheets, warranties, and inspection history directly to equipment in the digital twin.

Two professionals in a control room review a wall-mounted screen displaying solar system diagnostics and asset information.
Operational Intelligence

Move from reactive reporting to proactive asset management. Unify thermal scans, issue history, asset records, and operational context to identify risks before they impact production.

A solar field worker wearing a helmet and safety vest stands in front of solar panels, holding a tablet showing performance charts.
Enterprise Fit

Work with your existing systems, not around them. SenseHawk integrates with project controls, document systems, SCADA/DAS, CMMS, and other enterprise tools through APIs and connectors.

A woman in a modern office stands at a desk with dual monitors, analyzing data dashboards related to solar operations.

Lifecycle

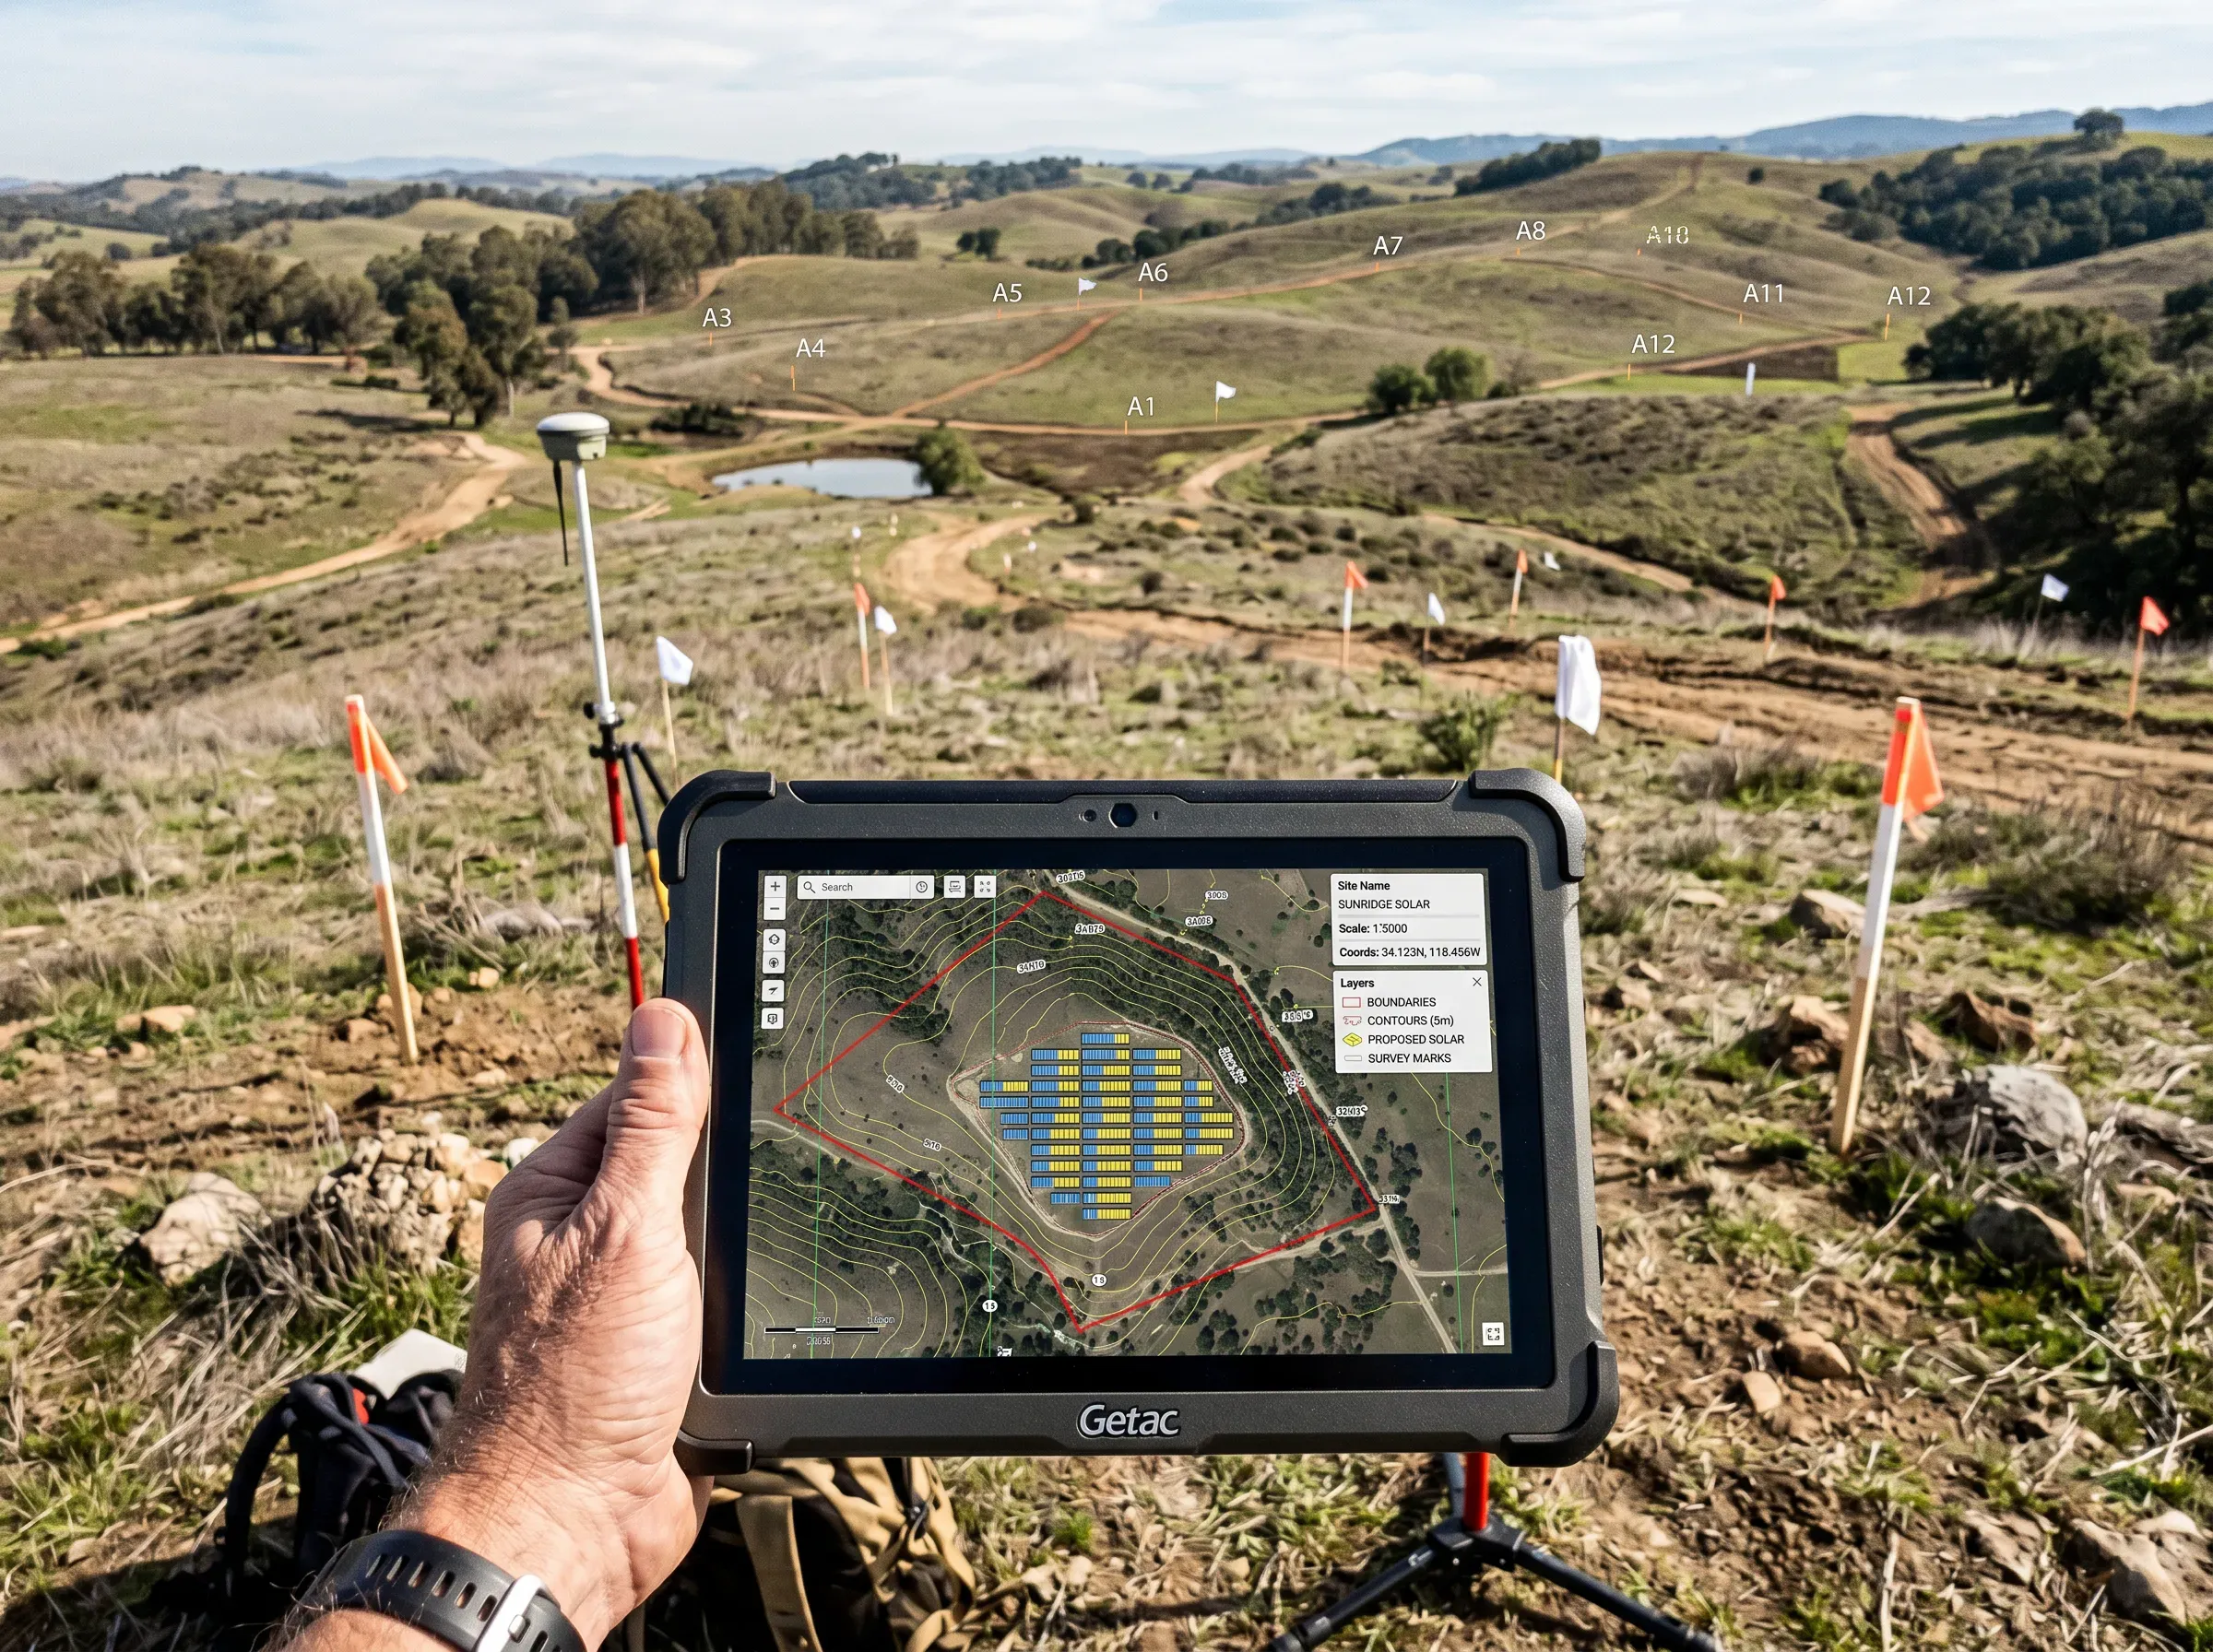
Control The Asset Lifecycle End-to-End.

SenseHawk keeps project data continuous across every phase - from site assessment through operations. That means cleaner handovers, faster decisions, and every team working from the same source of truth.

A person holds a tablet displaying a mapped solar site layout while standing in a grassy, undeveloped landscape marked for future construction.
Pre-construction

Digitize site intelligence early. Overlay GIS layers, terrain, design files, and permitting workflows in one place to reduce downstream surprises.

Pre-construction

Digitize site intelligence early. Overlay GIS layers, terrain, design files, and permitting workflows in one place to reduce downstream surprises.

Construction

Monitor schedule, quality, and field execution continuously. Link L5 work, inspections, drone imagery, and issues to a live project view.

Construction

Monitor schedule, quality, and field execution continuously. Link L5 work, inspections, drone imagery, and issues to a live project view.

Construction

Monitor schedule, quality, and field execution continuously. Link L5 work, inspections, drone imagery, and issues to a live project view.

Workers in safety gear install solar panels at a large construction site, while another worker reviews progress on a tablet with rows of panels and machinery in the background.
Technician in safety gear using a tablet while inspecting solar equipment with a thermal camera in a solar farm.
Commissioning & Handover

Standardize checklists, testing, punch lists, and closeout documentation so operations teams inherit complete, structured asset intelligence.

Commissioning & Handover

Standardize checklists, testing, punch lists, and closeout documentation so operations teams inherit complete, structured asset intelligence.

Operations & Maintenance

Tie thermal anomalies, maintenance history, warranty records, and operational data back to the asset model to improve uptime and accountability.

Operations & Maintenance

Tie thermal anomalies, maintenance history, warranty records, and operational data back to the asset model to improve uptime and accountability.

Operations & Maintenance

Tie thermal anomalies, maintenance history, warranty records, and operational data back to the asset model to improve uptime and accountability.

Engineer standing beside solar panels reviewing performance data on a tablet at a solar energy site.

Trusted by Teams Building and Operating Solar at Scale

of Solar and Storage Supported

0+ GW

of Solar and Storage Supported

0+ GW

Sites Digitized

0+

Countries

0+

Countries

0+

Savings per 100 MW Project

$0k

Savings per 100 MW Project

$0k

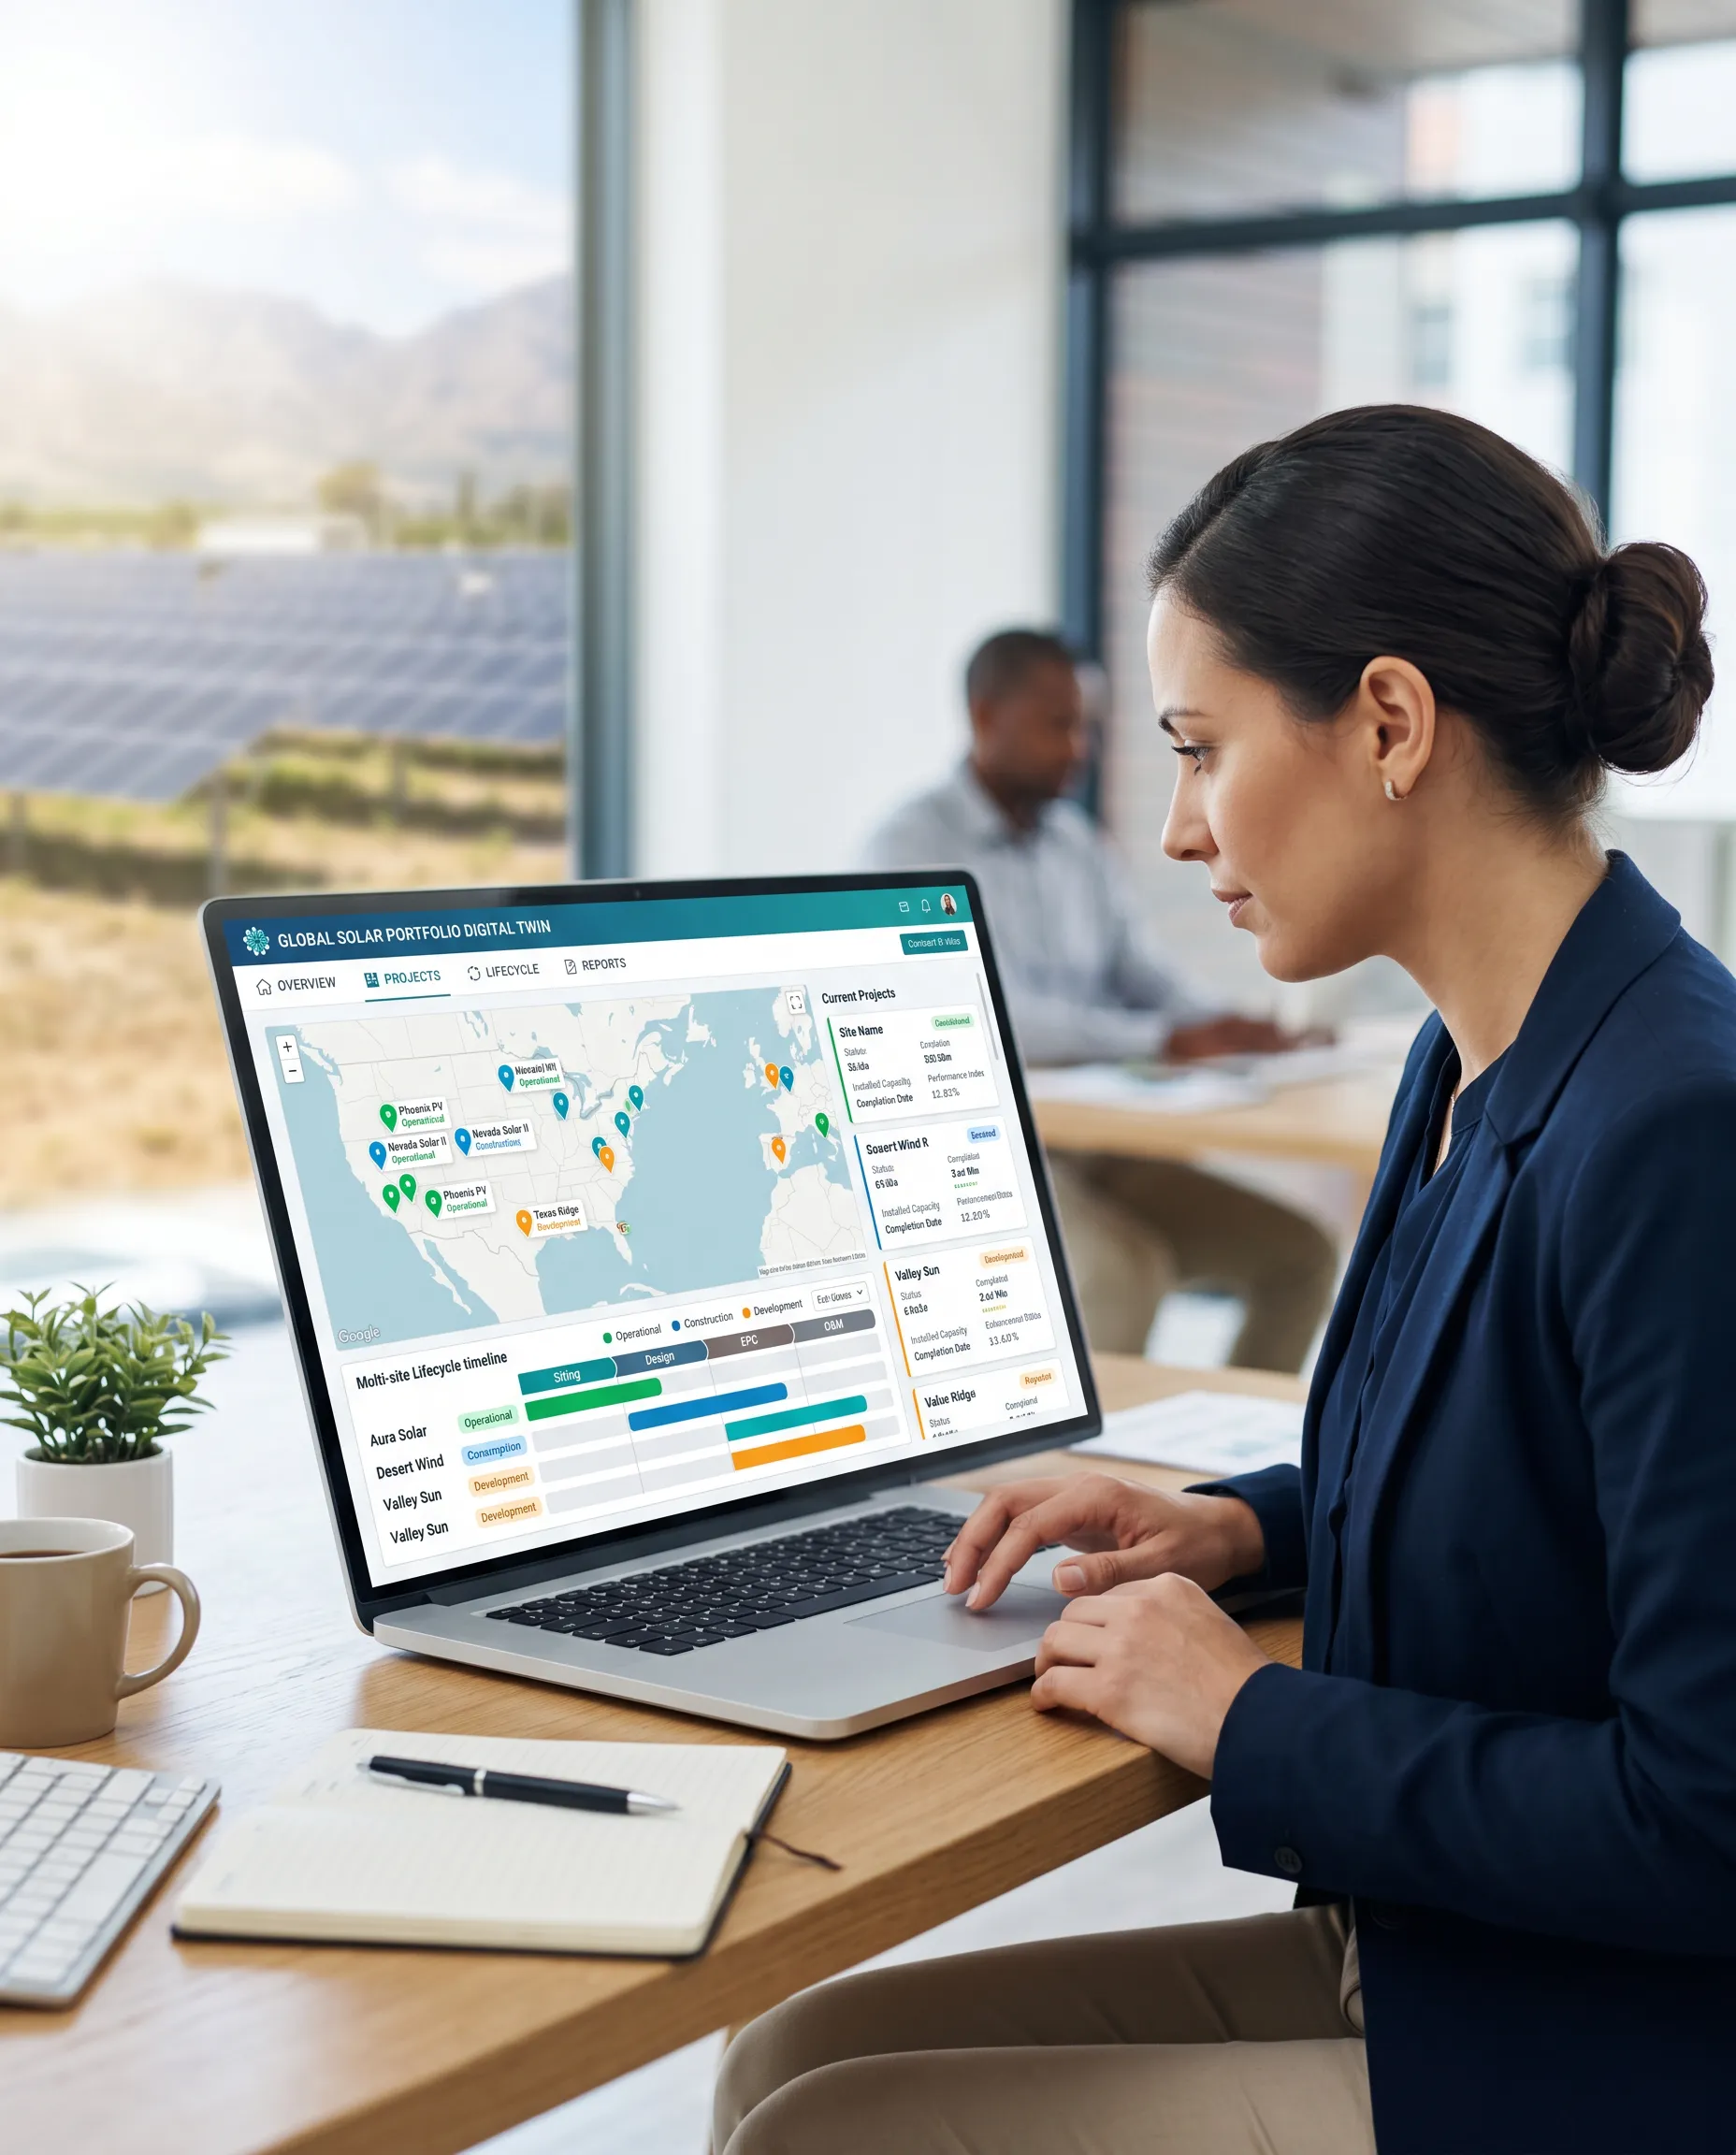
Executive Visibility

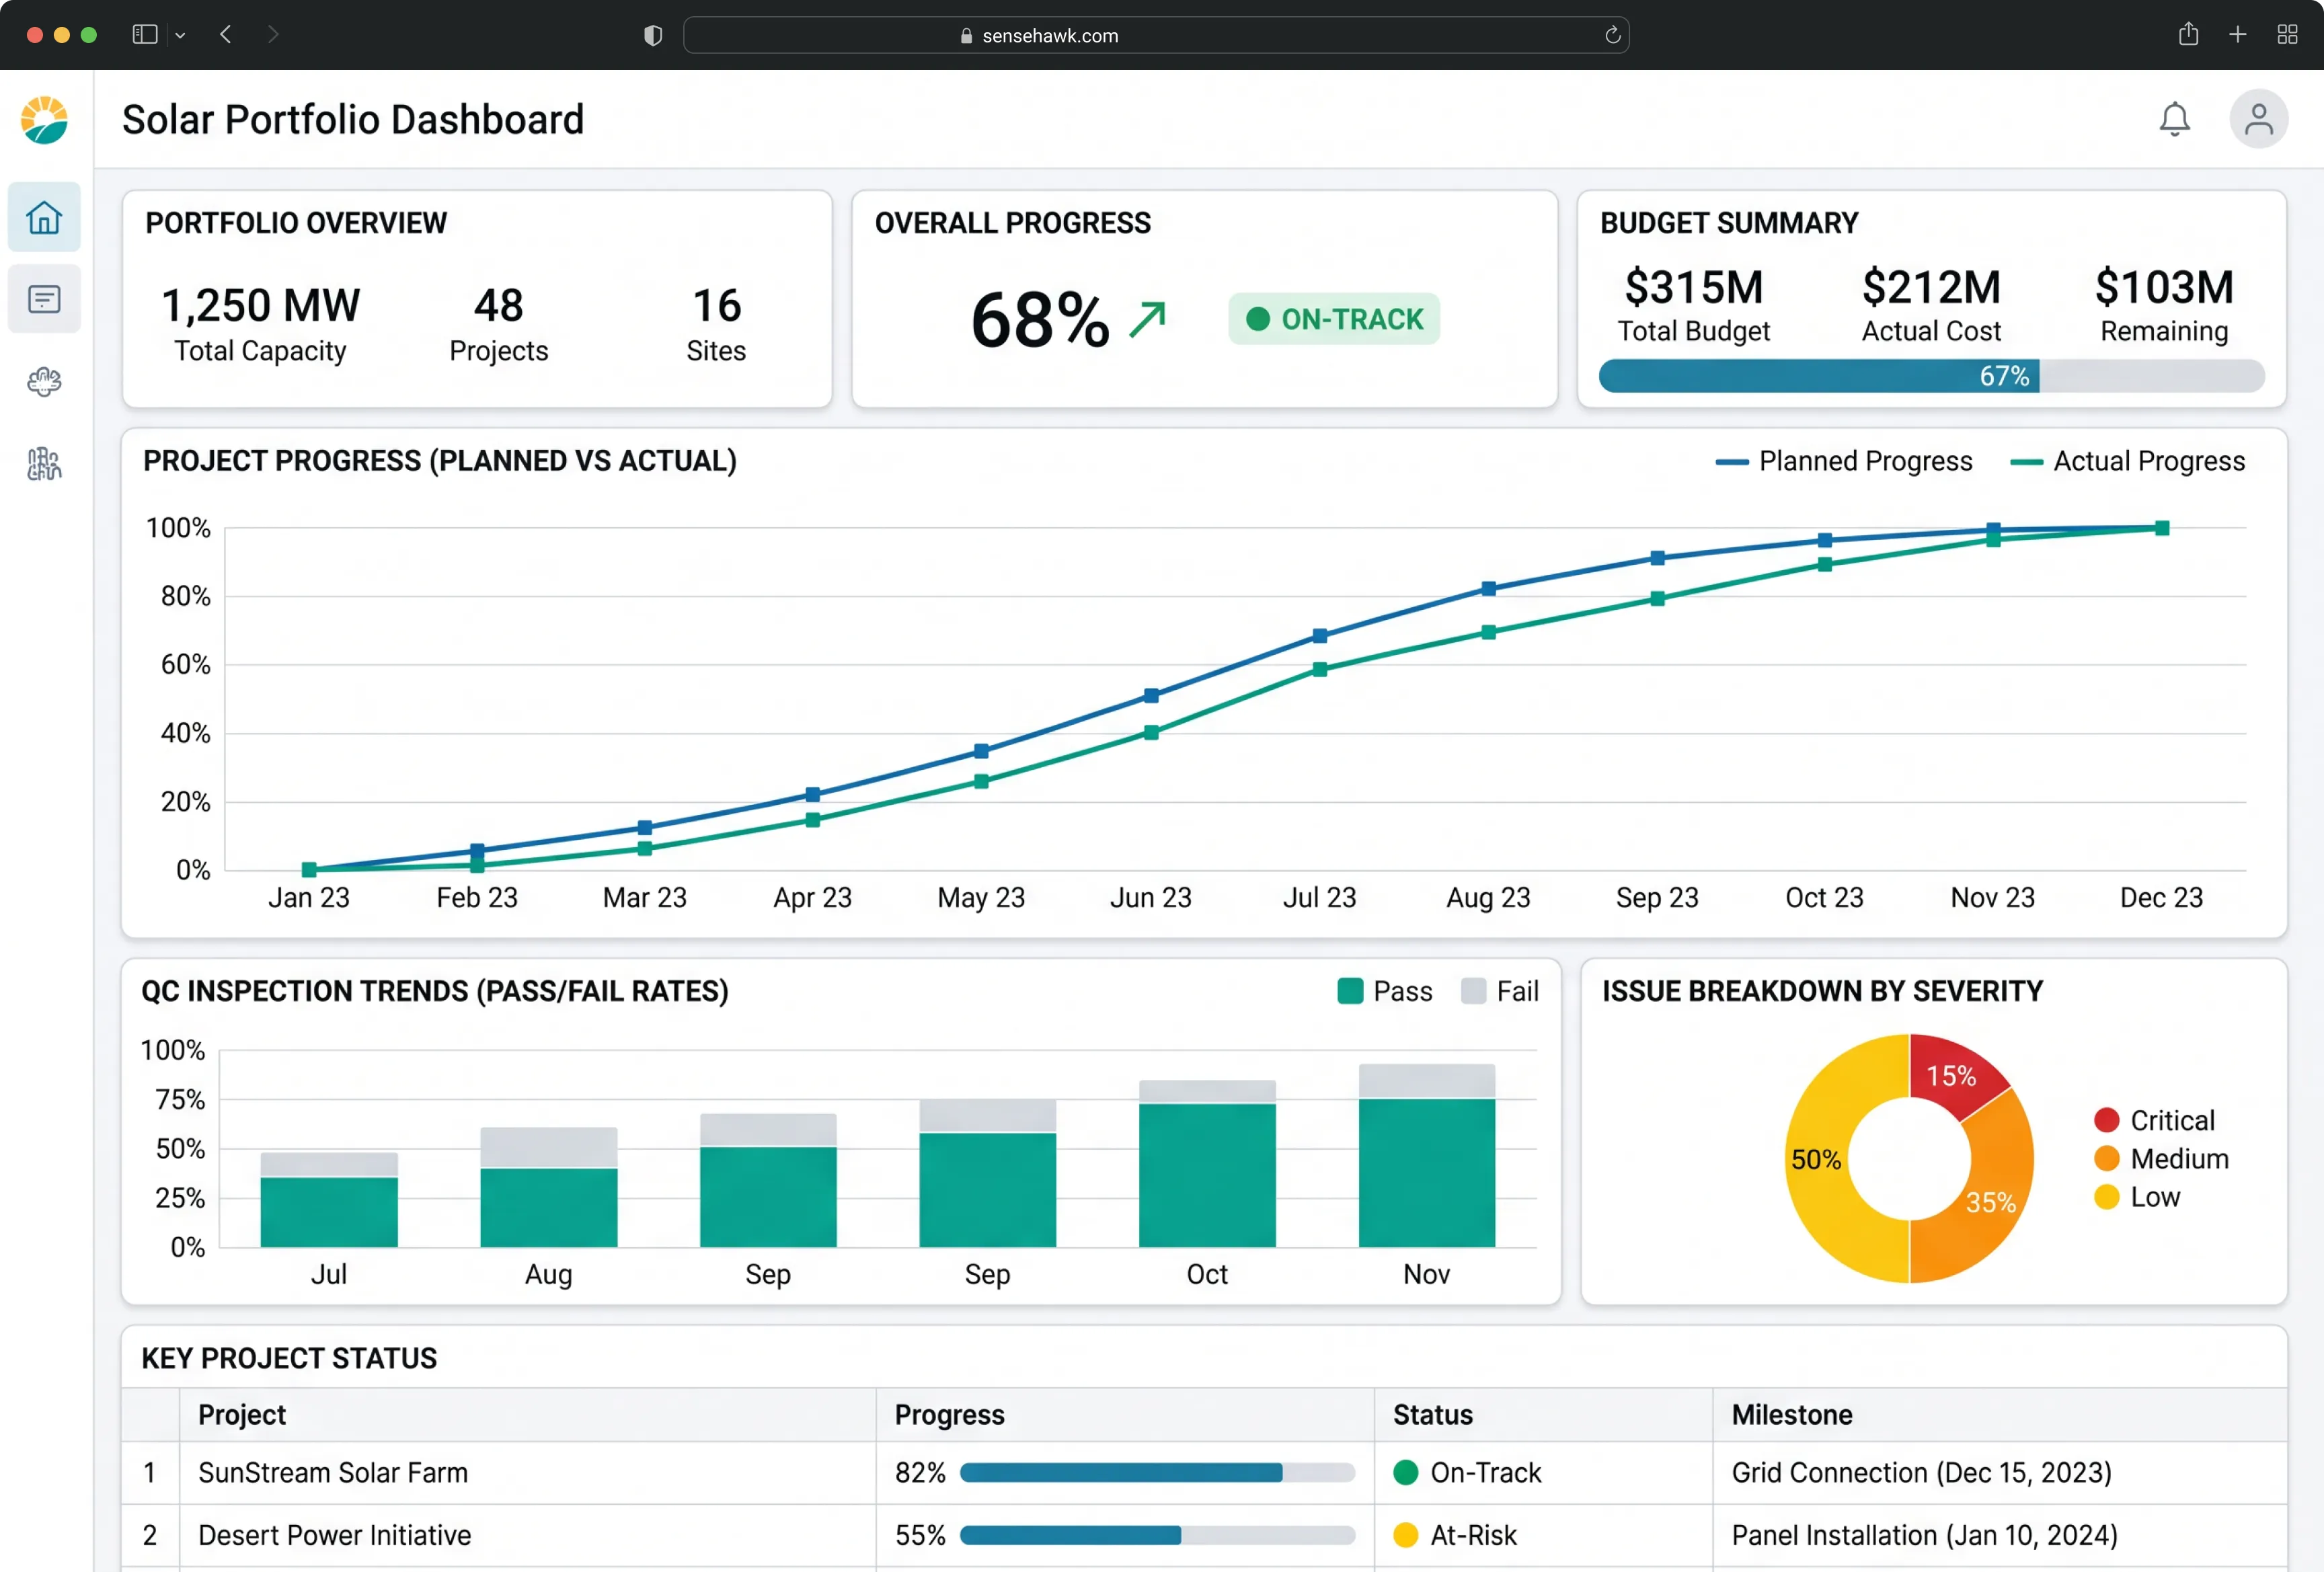
From Dashboards To Decisions.

Owners do not need more reports. They need clarity. SenseHawk brings together progress dashboards, S-curves, QC trends, issue root-cause analysis, and asset-level drilldowns so executives and asset managers can move from "what happened?" to "what needs action now?"

Solar portfolio dashboard displaying project overview, overall progress at 68% (on-track), and budget summary with $315M total budget, $212M actual cost, and $103M remaining. Includes charts for planned vs. actual project progress over time, QC inspection pass/fail trends, issue breakdown by severity, and a table of key project statuses with progress and milestones.

NaaviX AI

Ask Better Questions. Get Faster Answers.

With NaaviX, your team can query project and asset data in natural language - from construction risks and lagging activities to recurring thermal issues and inspection trends. Instead of digging through dashboards, teams can get contextual answers tied to the digital twin.

NaaviX Example Prompts

Which sites have the highest open quality risk this week?

What is delaying commissioning on this project?

Which strings show repeated thermal anomalies?

Where are handover documents still incomplete?

A man sits at a desk in an office, working on a computer that displays data dashboards and charts. Through a large window behind him, a group of workers in safety vests are installing solar panels at an outdoor site.

Frequently Asked Questions

How does SenseHawk improve my ROI?

How does SenseHawk improve my ROI?

Can I monitor multiple EPCs across different regions?

Can I monitor multiple EPCs across different regions?

How does this simplify the handover process?

How does this simplify the handover process?